
A privacy-friendly guide to app analytics
What are app analytics exactly? And how does TelemetryDeck keep your user's privacy safe?

App analytics are a fundamental part of analytics regarding app performance, an essential aspect of the satisfaction of your app's users and the growth of your app. Unfortunately, most analytics software doesn't provide a safe way to protect user privacy and data. Like you, we at TelemetryDeck believe users deserve respect by respecting their privacy.
But what are app analytics exactly? And how does TelemetryDeck keep your user's privacy safe? There are different types of app analytics, and all have their own way of tracking data and user activity. There are other ways of analyzing the data gathered to benchmark those analytics successfully. Let's take a look at how analytics work!
Types of analytics
When you are starting off with your brand-new app, you need to ask yourself what types of mobile analytics you want to take a closer look at. Mobile analytics are data generated by users from mobile apps and mobile web apps. Events are an important part here, because they standardize the data model regardless of where the data is coming from - an actual app or a website. There are five major types of analytic events that are of interest for app devs:
- Advertising
- Engagement
- Monetization
- Performance
- and App Store
Part of Engagement Analytics are App Analytics and Behavioral Analytics, which are the most popular type of analytics that determine how users interact with your product.
App Analytics
App Analytics, or In-App Engagement Analytics, will show how users interact with your app, how long they have interacted with certain aspects of your app, and they can also show commonly used processes.
With In-App Analytics, you can emphasize the most used and valued parts of your app and find bottlenecks and performance issues. All this can help enhance your users' experience and improve critical processes like checkouts and registrations.
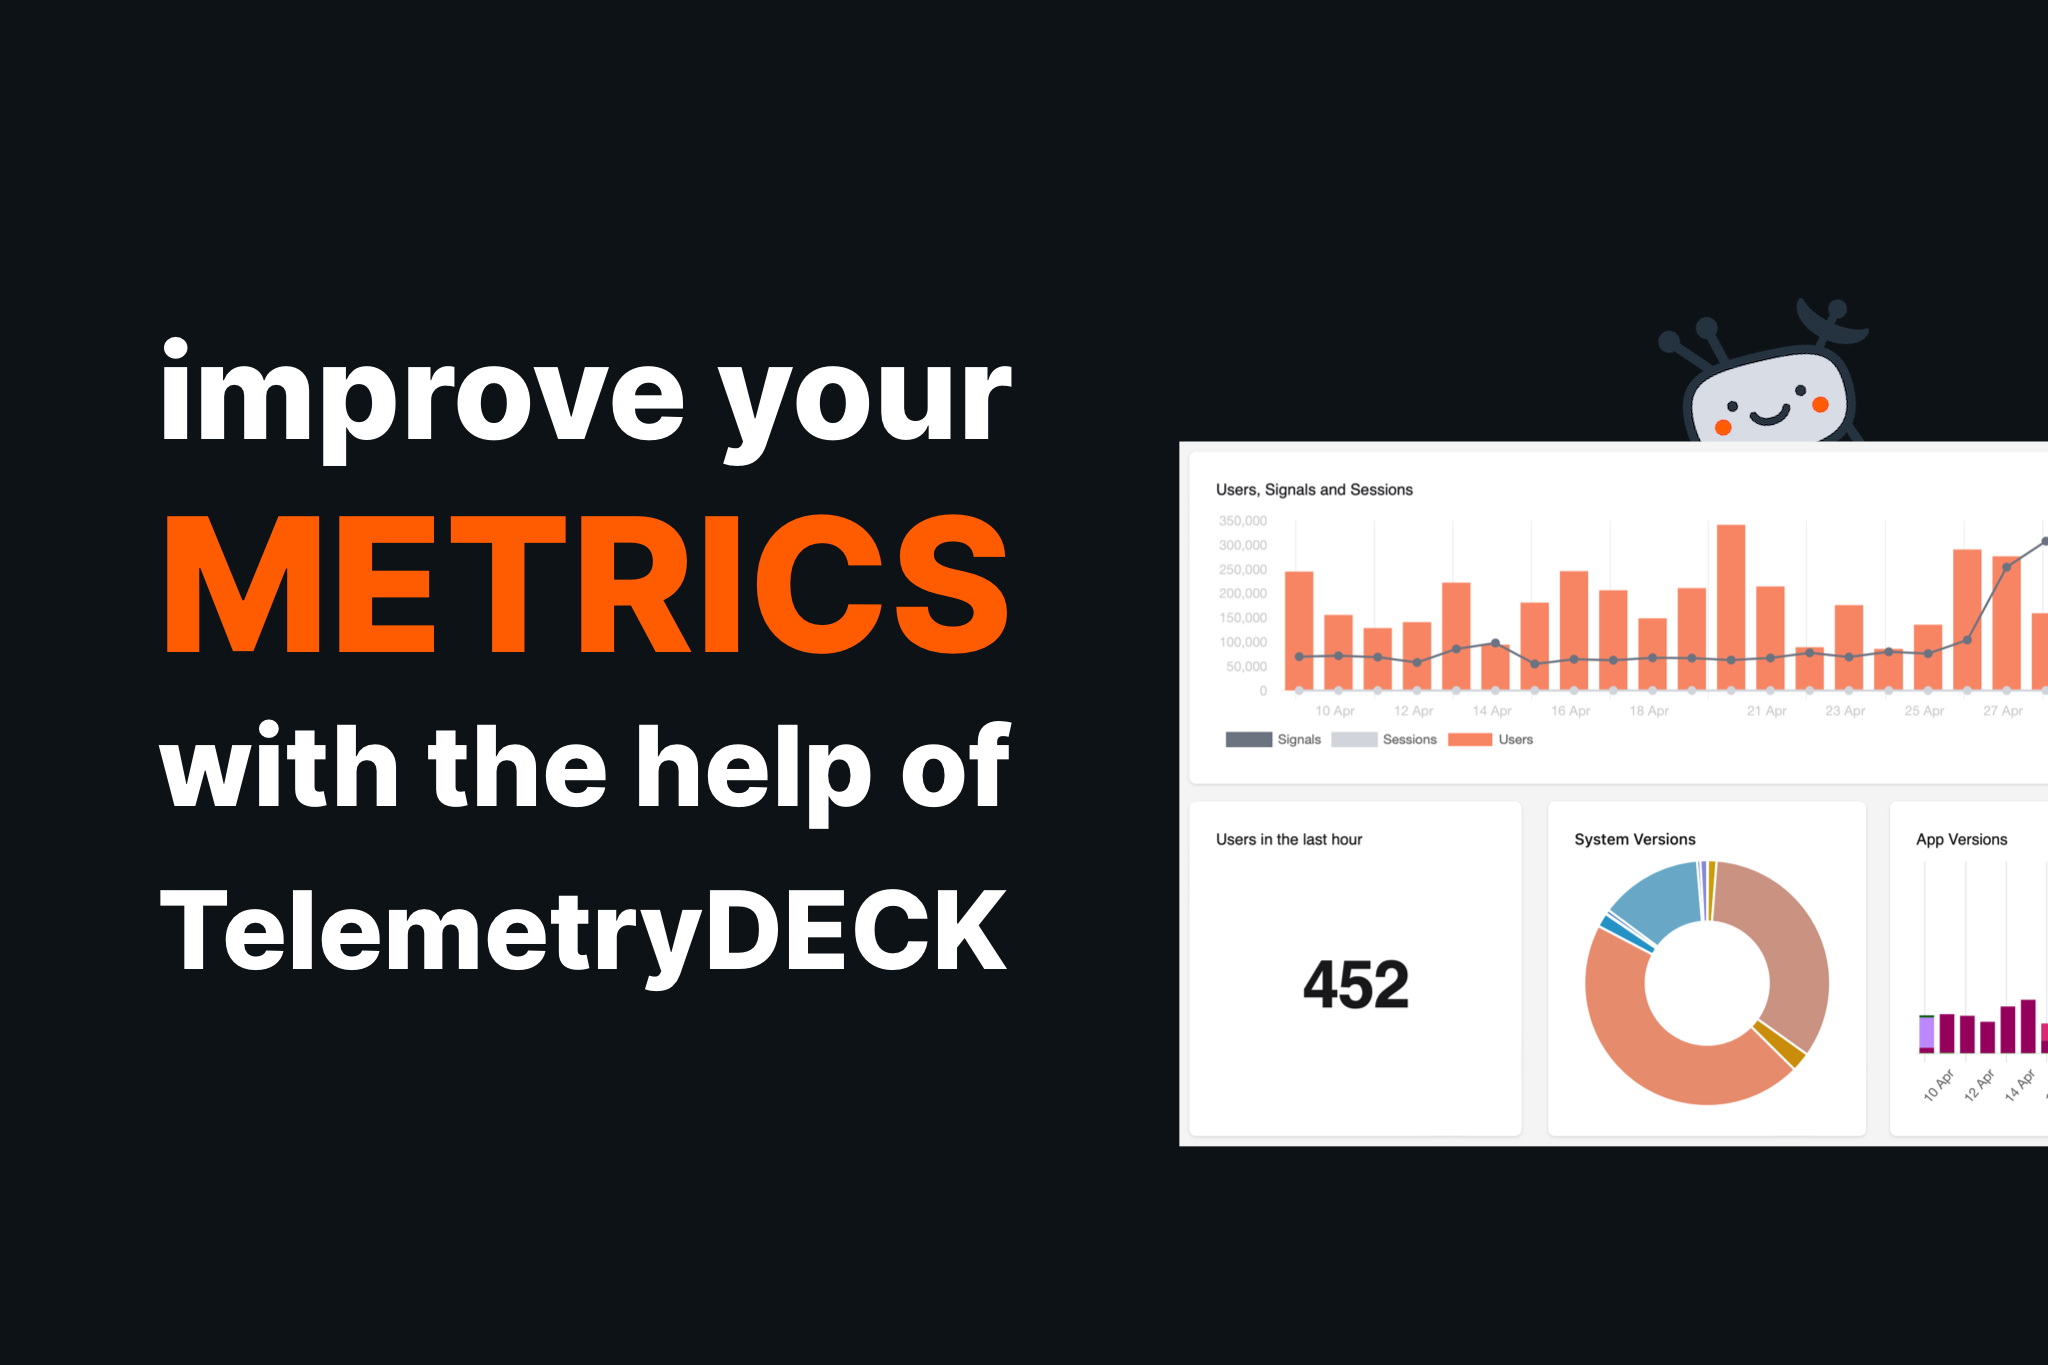
These are also the most vulnerable analytics types since they feature end-user data. App analytics need to be privacy compliant under almost every international law. But don't worry! We got you. With the help of TelemetryDeck, you can focus on building your best app without the hassle of diving too deep into international privacy laws. Our dashboard provides you with the tools to start right away. Your insights are displayed as visually appealing charts and graphs, and you don't need to worry about invading your users' privacy.
Behavioral Analytics
With Behavioral Analytics we take a closer look at how users engage with our business by checking: page views, email sign-ups, social media interactions, and marketing responsiveness.
Applying our learning's from tracking behavioral engagement can mitigate user frustration and increase conversion rates. Understanding how engaged your users are with your business, and what they like or don't like, will ultimately help you decide what is really worth working on and what features to focus on.
The best part: Behavioral Analytics don't need to be tied to identifiable data, which makes it perfect for privacy-friendly analytics!
The best way to analyze your app
Analyzing an app is easier than ever with TelemetryDeck. As mentioned before, our dashboard gives you all the right tools to analyze your app user behavior.
You can filter your insights by
- platform: major and minor versions of iOS, Android
- by date, be it today, the past week, or a custom range date
- the number of active users
- and many more!
Now you got your insights, but how do you analyze data provided by your app? At TelemetryDeck, you get an easy-to-read visualization of your insights. We ensure you can see at a glance if your app performs well and if your users are happy. That way, you can easily focus on developing your app and building a satisfied user base that will love your app!
You can add all your apps to your dashboard and categorize your insights into insight groups. Use our amazing charts, and try out our query language to get custom queries tailored to your needs!
Tracking the right analytics
Let's talk about significant insights! What analytics should you track for your app? Well, that mostly depends on your goals and intentions. But there are a few metrics you might want a more in-depth insight on:
For example, your app's Daily Active Users (DAU) and the Monthly Active Users (MAU). These two insights help you feel accomplished, which is important in itself, and give you the fundamentals to see how much your users like your app. With these insights, you can calculate the retention rate and how likely your users will return to the app. They are one of the most basic and fundamental insights.
Consider the case where your monthly users are declining (suppose they used the app for more than one month), but your daily users are rising. What can this tell us? If daily users are increasing, but monthly users go down, that might be a sign for a few people who enjoy your app and use it often but many more who do not return to it.
Now, what could cause a decline in monthly users? That is something you can track with TelemetryDeck, too! You can see if users face any issues while using your app:
- Do they leave the app at a specific point, e.g., during the checkout process?
- Do they not use features that are significant to your app?
- More reasons that might apply to your specific app.
Based on the insights you get from DAU and MAU, you can continue with insights about downloads and updates during a given period, and so on.
Measuring app success
Although the insights you have now gathered all seem valuable, not all of them are significant to the success of your project. With all the insights, what data would be best for benchmarking the success of your app? There are a few key insights that apply to most cases:
Number of active users (DAU/MAU)
Tracking how many users use your app daily (DAU) and monthly (MAU) gives you the best insight into how much users like your app. Total downloads often indicate how well your marketing works, but you want your users to stick to your app!
Stickiness shows how likely users will return within a month, and it depends highly on the group of people you are catering to. A sticky app gets launched more often, while a less sticky app is maybe just launched once a month.
You can calculate stickiness by dividing DAU by MAU and multiplying it by 100 to get the percentage; the higher, the better.
Retention rate
The retention rate shows you how many people return to your app or how loyal people are to your app. Other than stickiness, this is used on a larger scale. Stickiness is within a month; retention is over a span of several months.
It is beneficial whenever you add new features and will show you if users like or dislike changes! Calculate the retention rate by subtracting the number of users acquired during a period from the number of users at the end of a period, then dividing the result by the number of users at the start. The percentage of that equals your retention rate; the higher, the better.
TelemetryDeck provides a graphical representation of your app's user retention in the dashboard.
Lifetime value (LTV)
Also known as Customer Lifetime Value (CLV), this metric shows whether a user turns out net positive or net negative. You calculate the revenue a user generates during their lifetime. This can either be directly through in-app purchases or indirectly through advertising.
App update behavior
The update behavior of your users can tell you so much about whether they are satisfied. If your users instantly update, they trust what you're building and probably can’t wait for new features! Is there a significantly big group still stuck on an older version? What is causing them not to update?
Maybe it is a feature that got removed in newer builds, perhaps an old API they still use, or perhaps your communication process is not sufficient. Potentially the update process has an error and is broken? And not to forget the obvious: make sure your users use the latest security patches!
AI & Machine Learning in App Analytics
Artificial intelligence is reshaping how teams work with analytics. As apps become more complex and datasets grow, the challenge is no longer collecting data. It is asking the right questions. AI and machine learning help bridge that gap by making analytics more accessible, reducing technical friction, and turning raw data into insights faster. Instead of wrestling with dashboards or query syntax, teams can explore their data in a more natural and intuitive way and focus on improving their product.
With Export for AI, TelemetryDeck brings AI-assisted workflows directly into app analytics without compromising on privacy. The feature allows you to share the structure of your analytics data with AI tools so they understand which events and signals exist in your app and how they can be queried. This enables AI systems to generate meaningful, context-aware analytics queries that are tailored specifically to your setup.
The result is faster insights, fewer barriers between questions and answers, and a much smoother path from data to decisions. Whether you are exploring user behavior, validating product ideas, or identifying trends, AI becomes a practical assistant, not a black box.
True to TelemetryDeck’s privacy-first approach, Export for AI never includes personal user data. You stay in control of what is shared while gaining a modern, AI-ready way to work with your analytics.
Additional insights
Learn more about how TelemetryDeck helps you in creating your privacy-focused app and what we do to make that happen - everyday!
How TelemetryDeck compares to Google Firebase Analytics
We went ahead and compared TelemetryDeck vs. Google Firebase Analytics to assure you that we really mean it when we say we care about privacy! In this comparison, we talk about what we do to keep your user’s data safe by using only the best pseudonymization techniques.
Basically, we take all that sensitive data and give it a new name. So even if someone were to get a hold of it, they wouldn’t know who it belongs to. From a technical perspective, we hash and salt the identifiers of your users. This way, you can still get insights from the data without putting anyone at risk.
Plus, we make sure to stay up-to-date on the latest privacy regulations, so you don’t have to worry about it!
Your 5 most important metrics to track
Figuring out the key metrics for your business is a tedious task. But there’s always a handful of metrics you probably shouldn’t miss out on, and we are going to tell you why!
Make sure to get the best out of your app by choosing the right metrics for you while also respecting your users privacy. Because you actually do not have to do without the other.
The best analytics tools you should know about
When it comes to analytics tools, there’s non like the other. Finding the perfect one for your product can be a tough choice. Whatever your requirements might be, privacy should always be on your mind - at least that’s what we stand for.
And that’s also why we summarized some of the best analytics tools out there to help you find the perfect fit, while also giving you the tools to make an informed decision!
The path to privacy and the importance of Google Analytics
Google Analytics has made efforts to address concerns by offering features like data anonymization and user opt-out mechanisms, based on international data regulations. As user concerns and behavior evolve, the market evolves with them, providing businesses with the tools they need to stay competitive and relevant in the analytics landscape.
Google Analytics is the leader on the market. But why is that so? We take a look at what makes Google Analytics so popular and how they value user data and privacy.
Analytics with Swift: A comprehensive guide
Did you know that when it comes to analytics for iOS apps, App Store Connect is the first step into your journey of discovering metrics and analyzing data? We share with you how you can utilize analytics for Swift-based apps and go even beyond what Apple offers you in their integrated analytics suite.
What are the main features of App Store Connect, and which third-party analytics apps can help you boost your experience and understand your user base? (Hint: We might have put TelemetryDeck in there. 😉)