View this page as Markdown • #docs #articles #intermediate #how-to #insights #visual-editor #Websites
Finding out the traffic sources for your Webpage
Are there patterns which websites your users visit before using your homepage? Here is our guide for getting a handy insight into just that.
To begin with, add a new insight in the dashboard of your choice and select Advanced Query so that you can proceed using the Visual Editor. 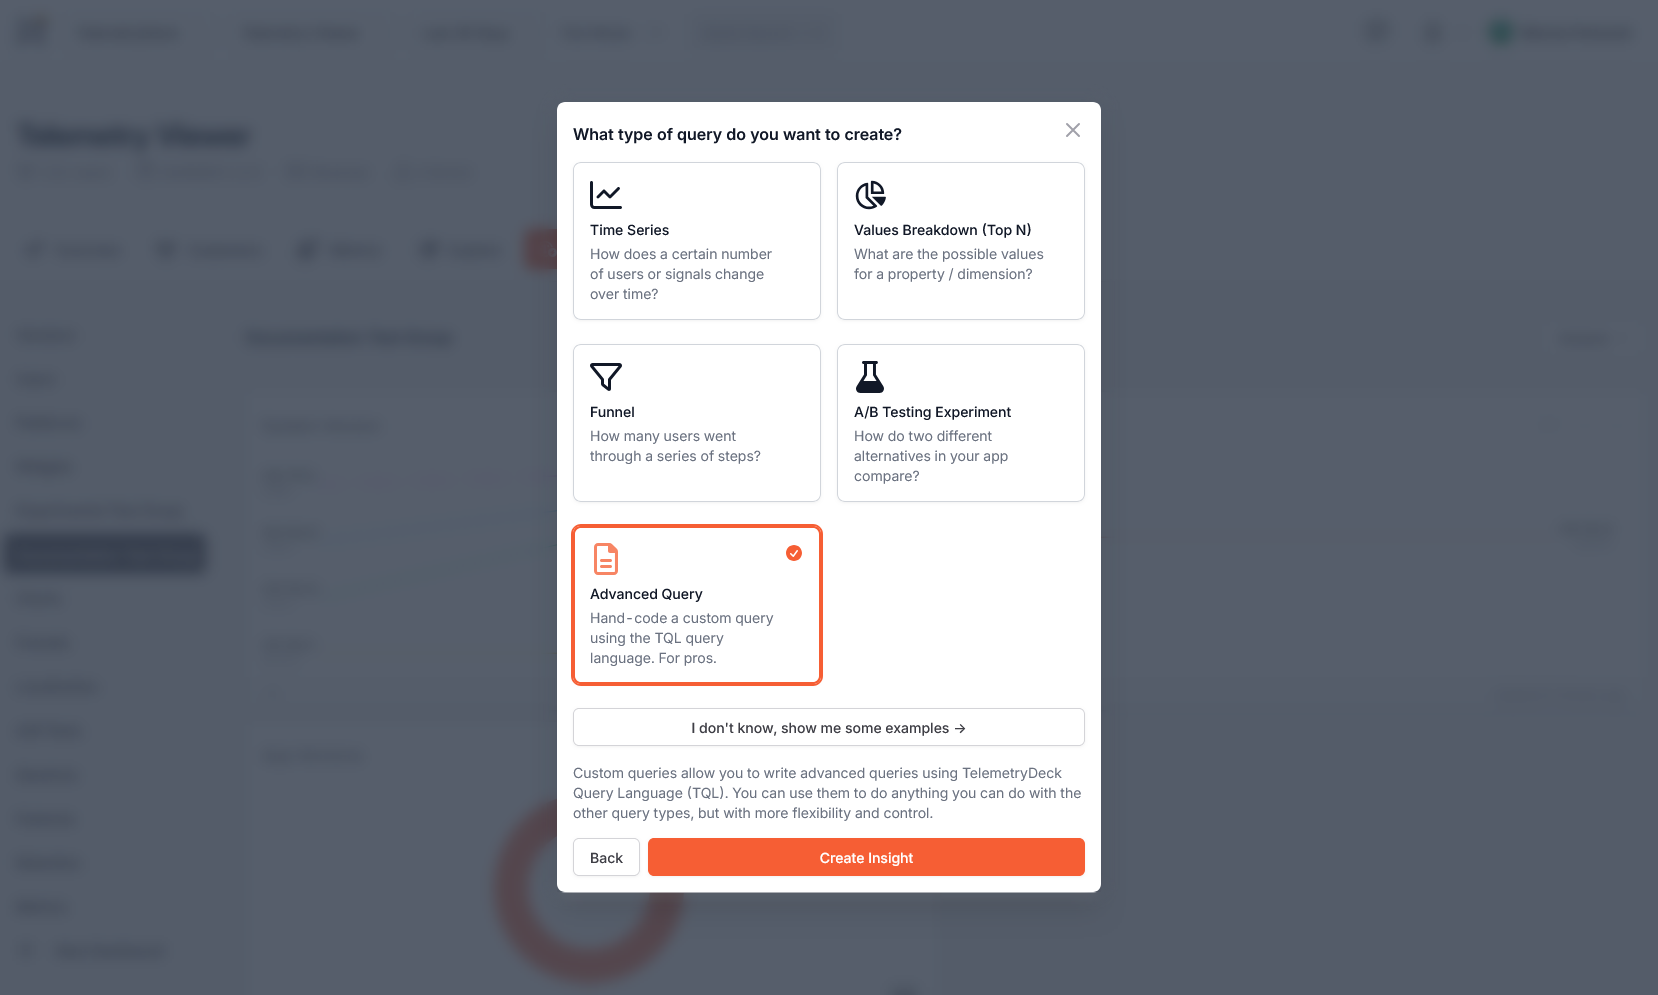
In the first section of the Visual Editor, Metadata, choose a
topN query- we propose granularityallso that you can display the information in a donut chart in the end.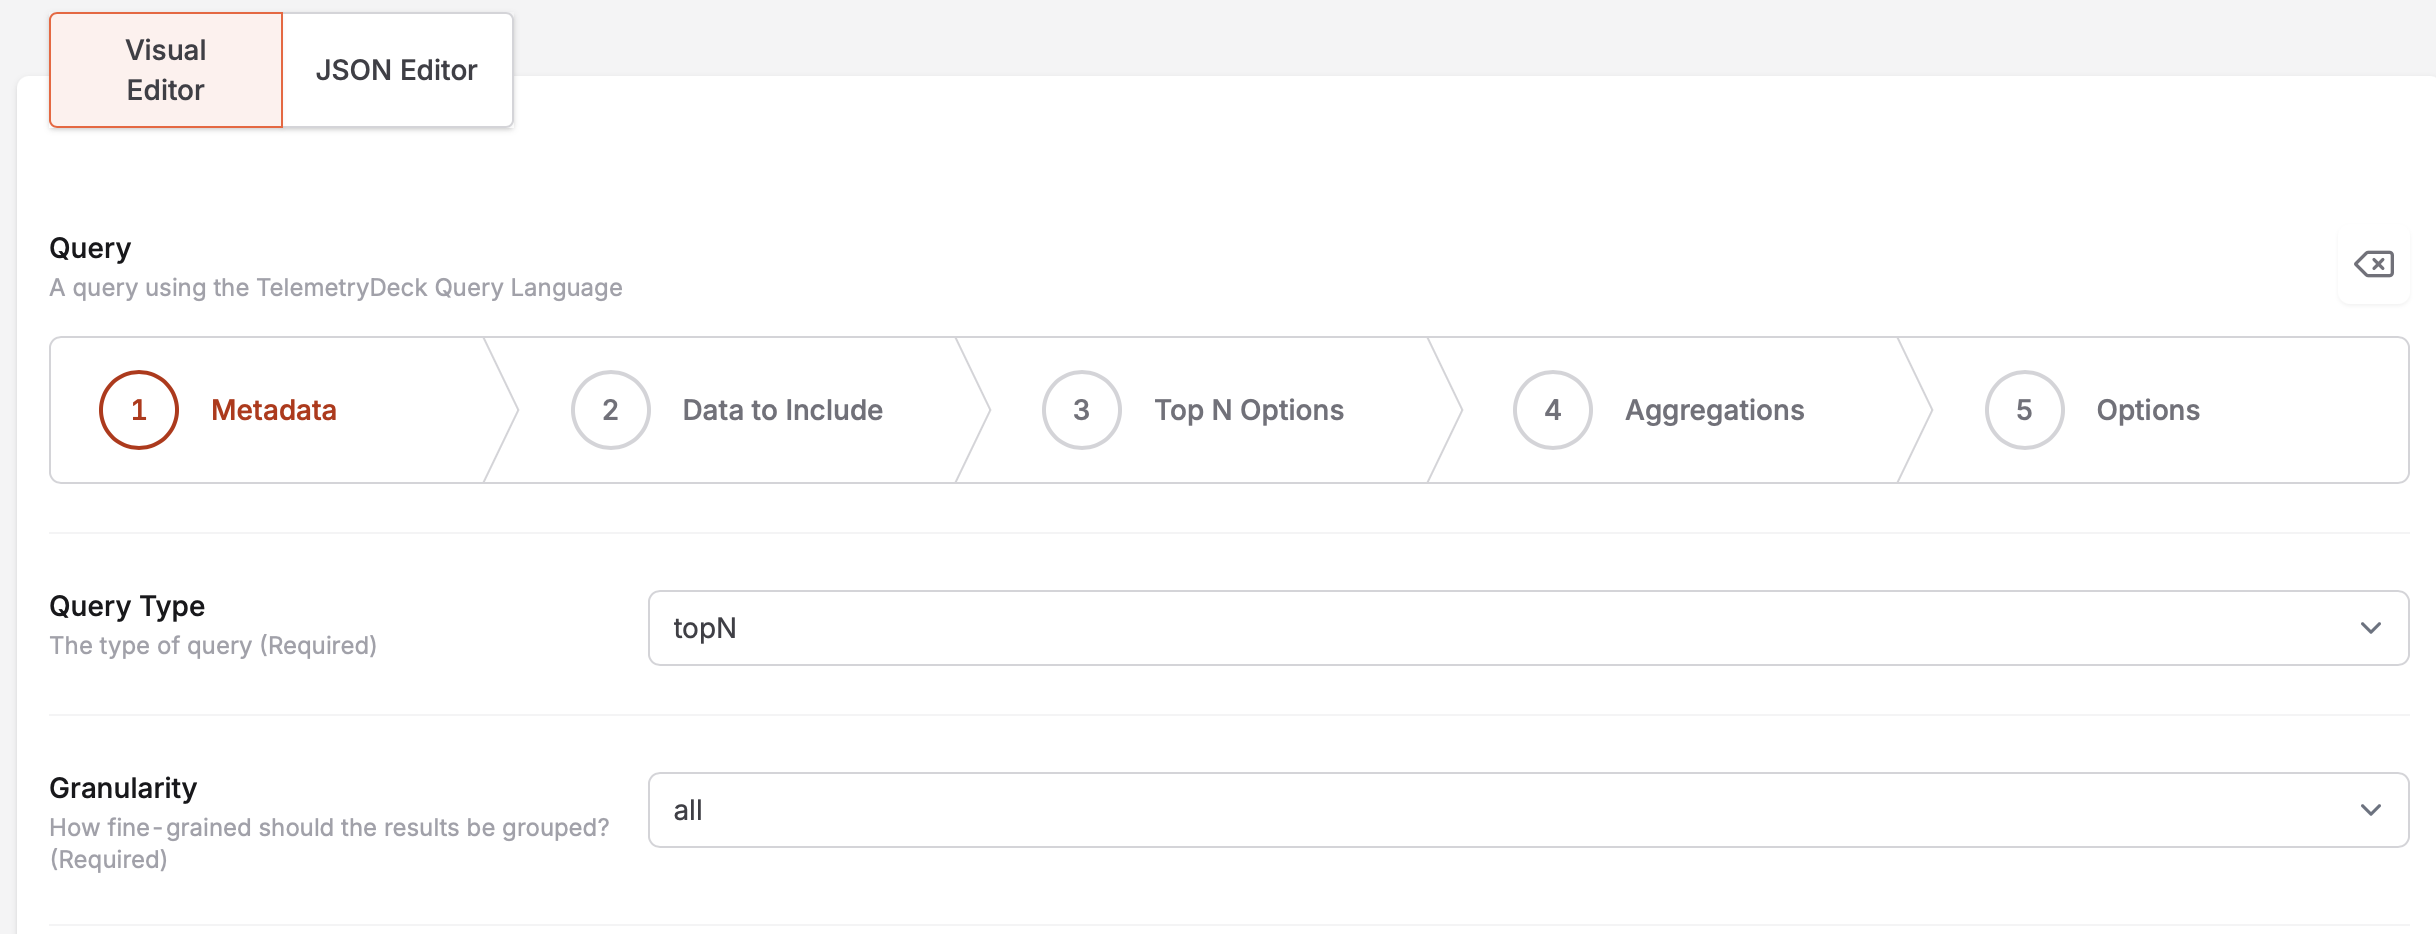
In the next step you can choose which Data to Include. To get started, add
thisAppas well as the respective App ID.Additionally, it is recommended to add a filter to avoid that parts of your own website are returned by the query. To achieve that add a
regexfilter with dimensionreferrerand domain as well as top-level-domain of your website separated by a\:referrer~yourDomain\.com. Please be aware that this is a rather basic regex filter as the purpose here is to show the creation of the query. More elements can be added to the filter of course.Once you have entered the information for the filter click on the field again and select
Negate (Wrap in "not" condition)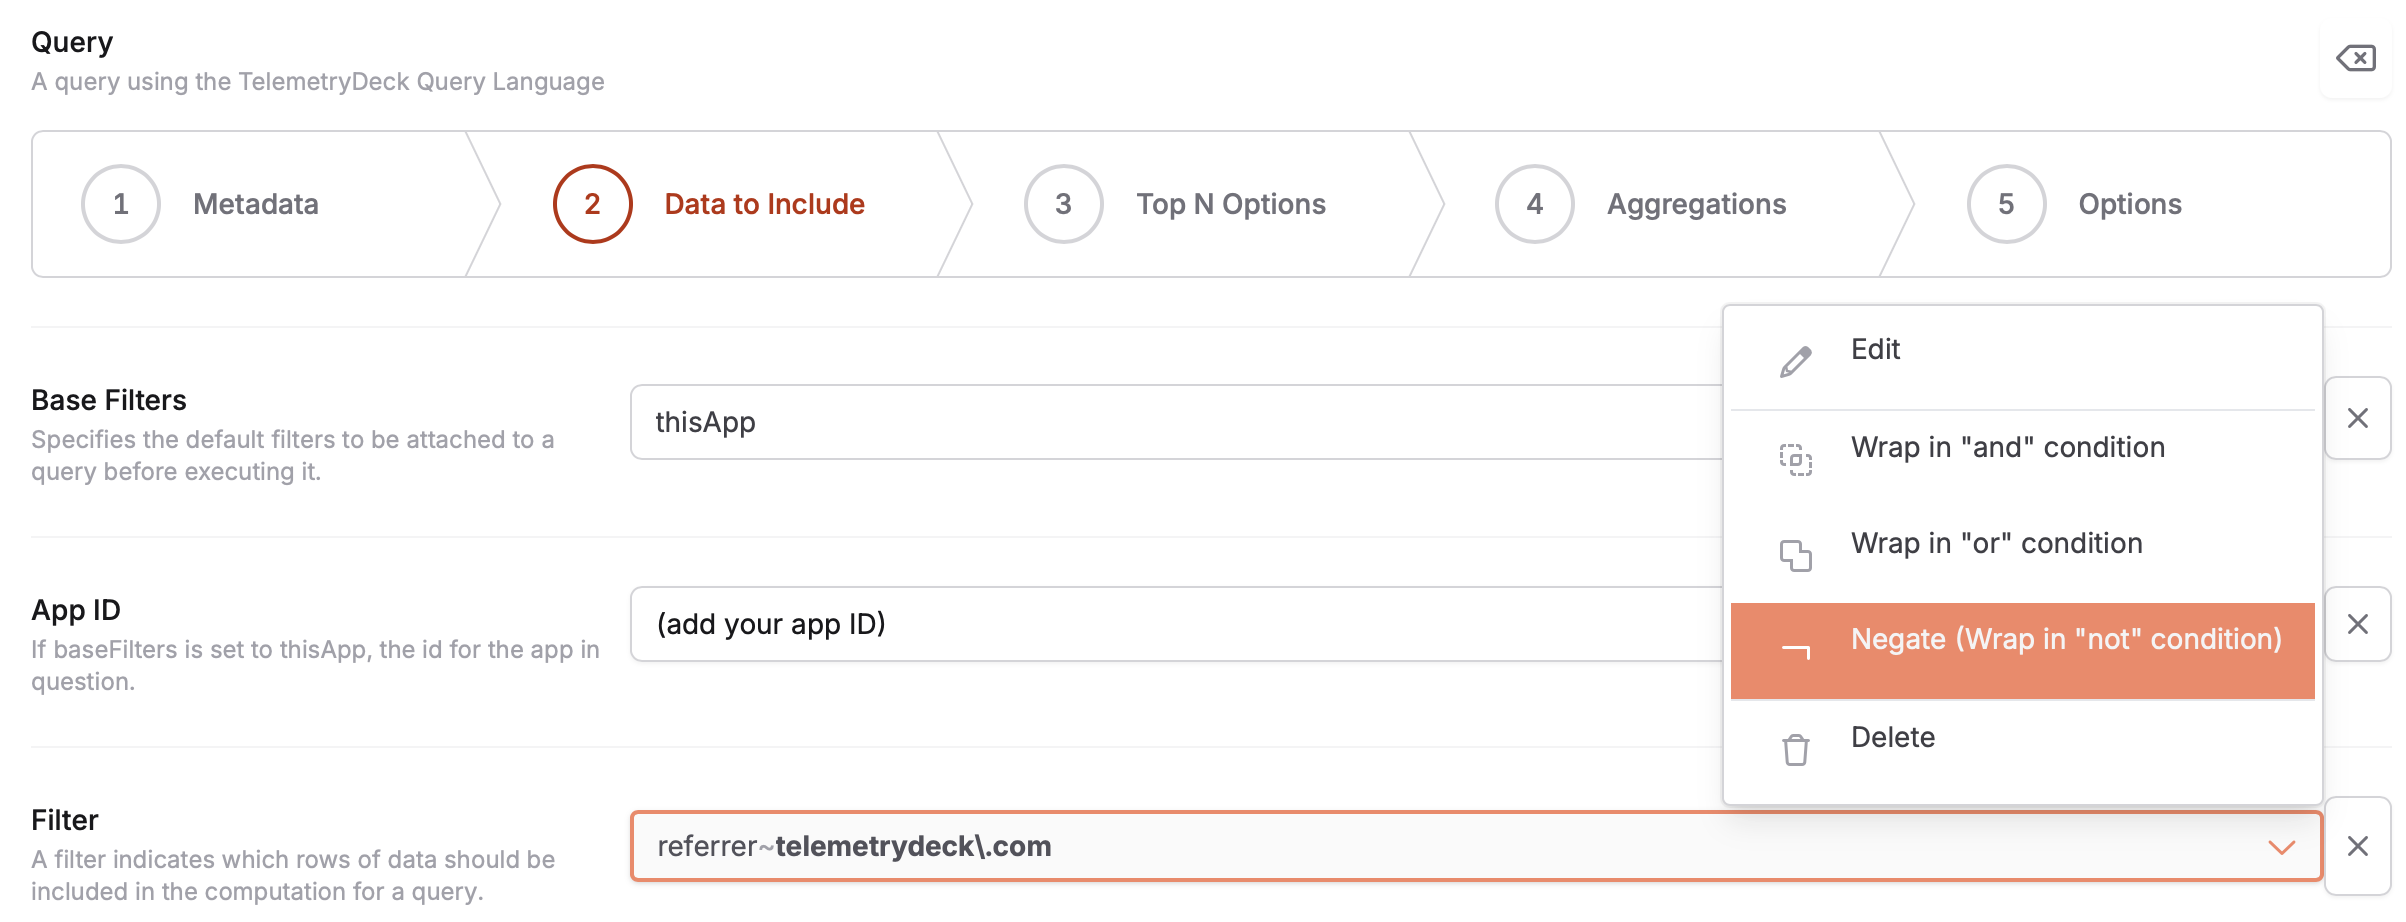 When you are finished, the filter in Data to Include section should look as follows:
  Additionally, feel free to add further information in the regex filter in case you want to exclude search engines besides your own website as referrers for example. This could be used in the
 regexfilter of the Visual Editor to expand the filter:(yourDomain\.com|google\.|bing\.|search\.brave|yandex\.|kagi\.|duckduckgo\.).The following section are topN Options. In the first part regarding the dimension, select type
defaultand type inreferrertwo times. Furthermore, choose anumericmetric and addcount. To wrap this section up choose the number of topN results to be returned, i.e. the threshold.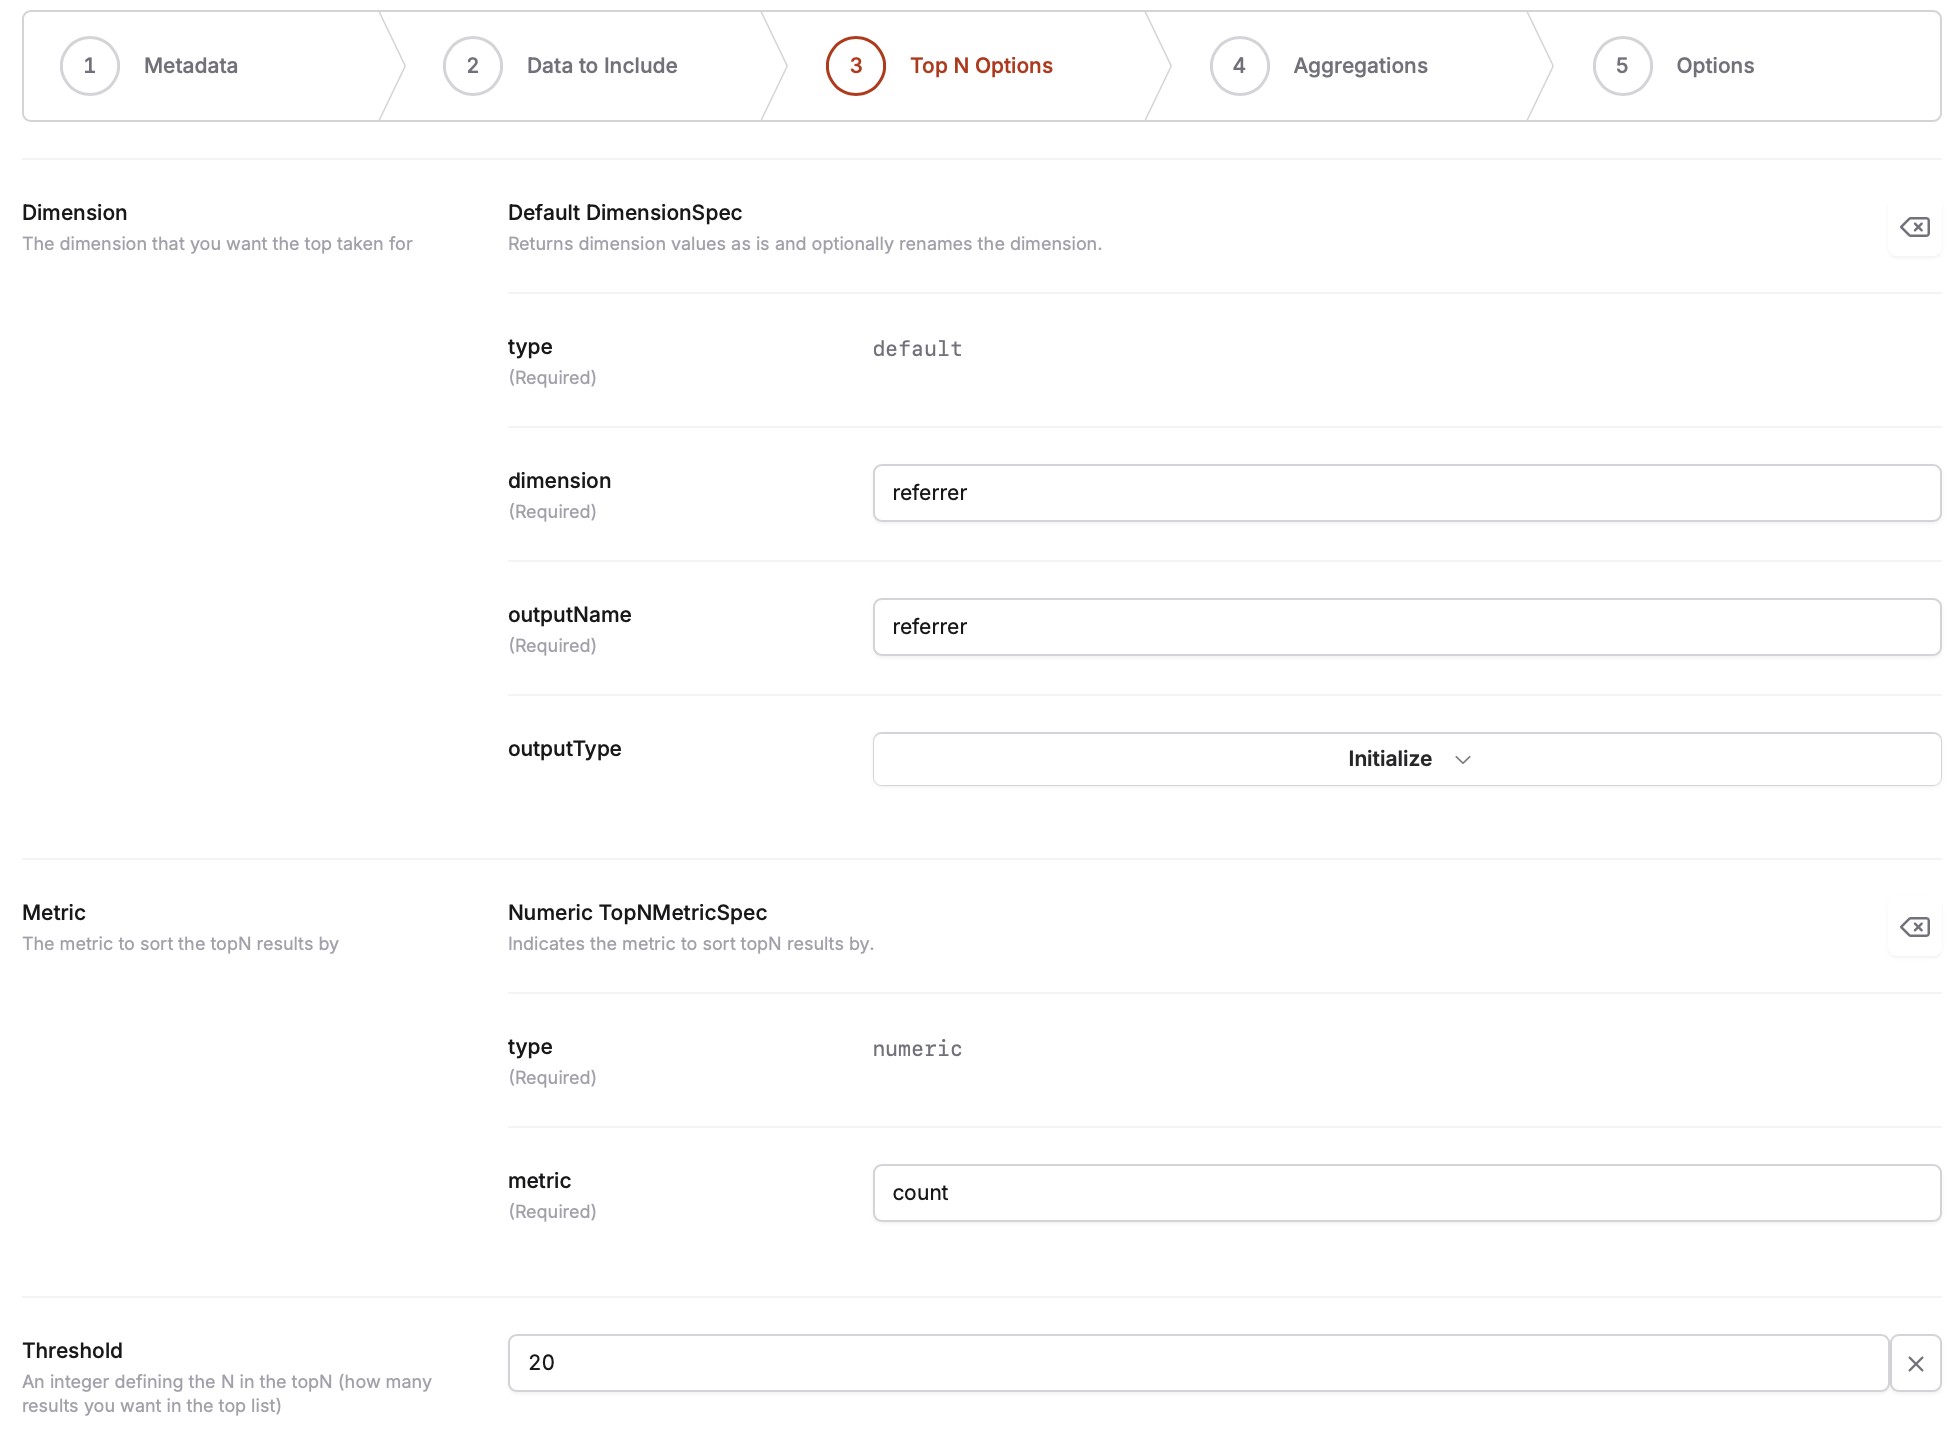
Finally, add a
longSum-aggregator for the Aggregations and type incountin the two respective fields.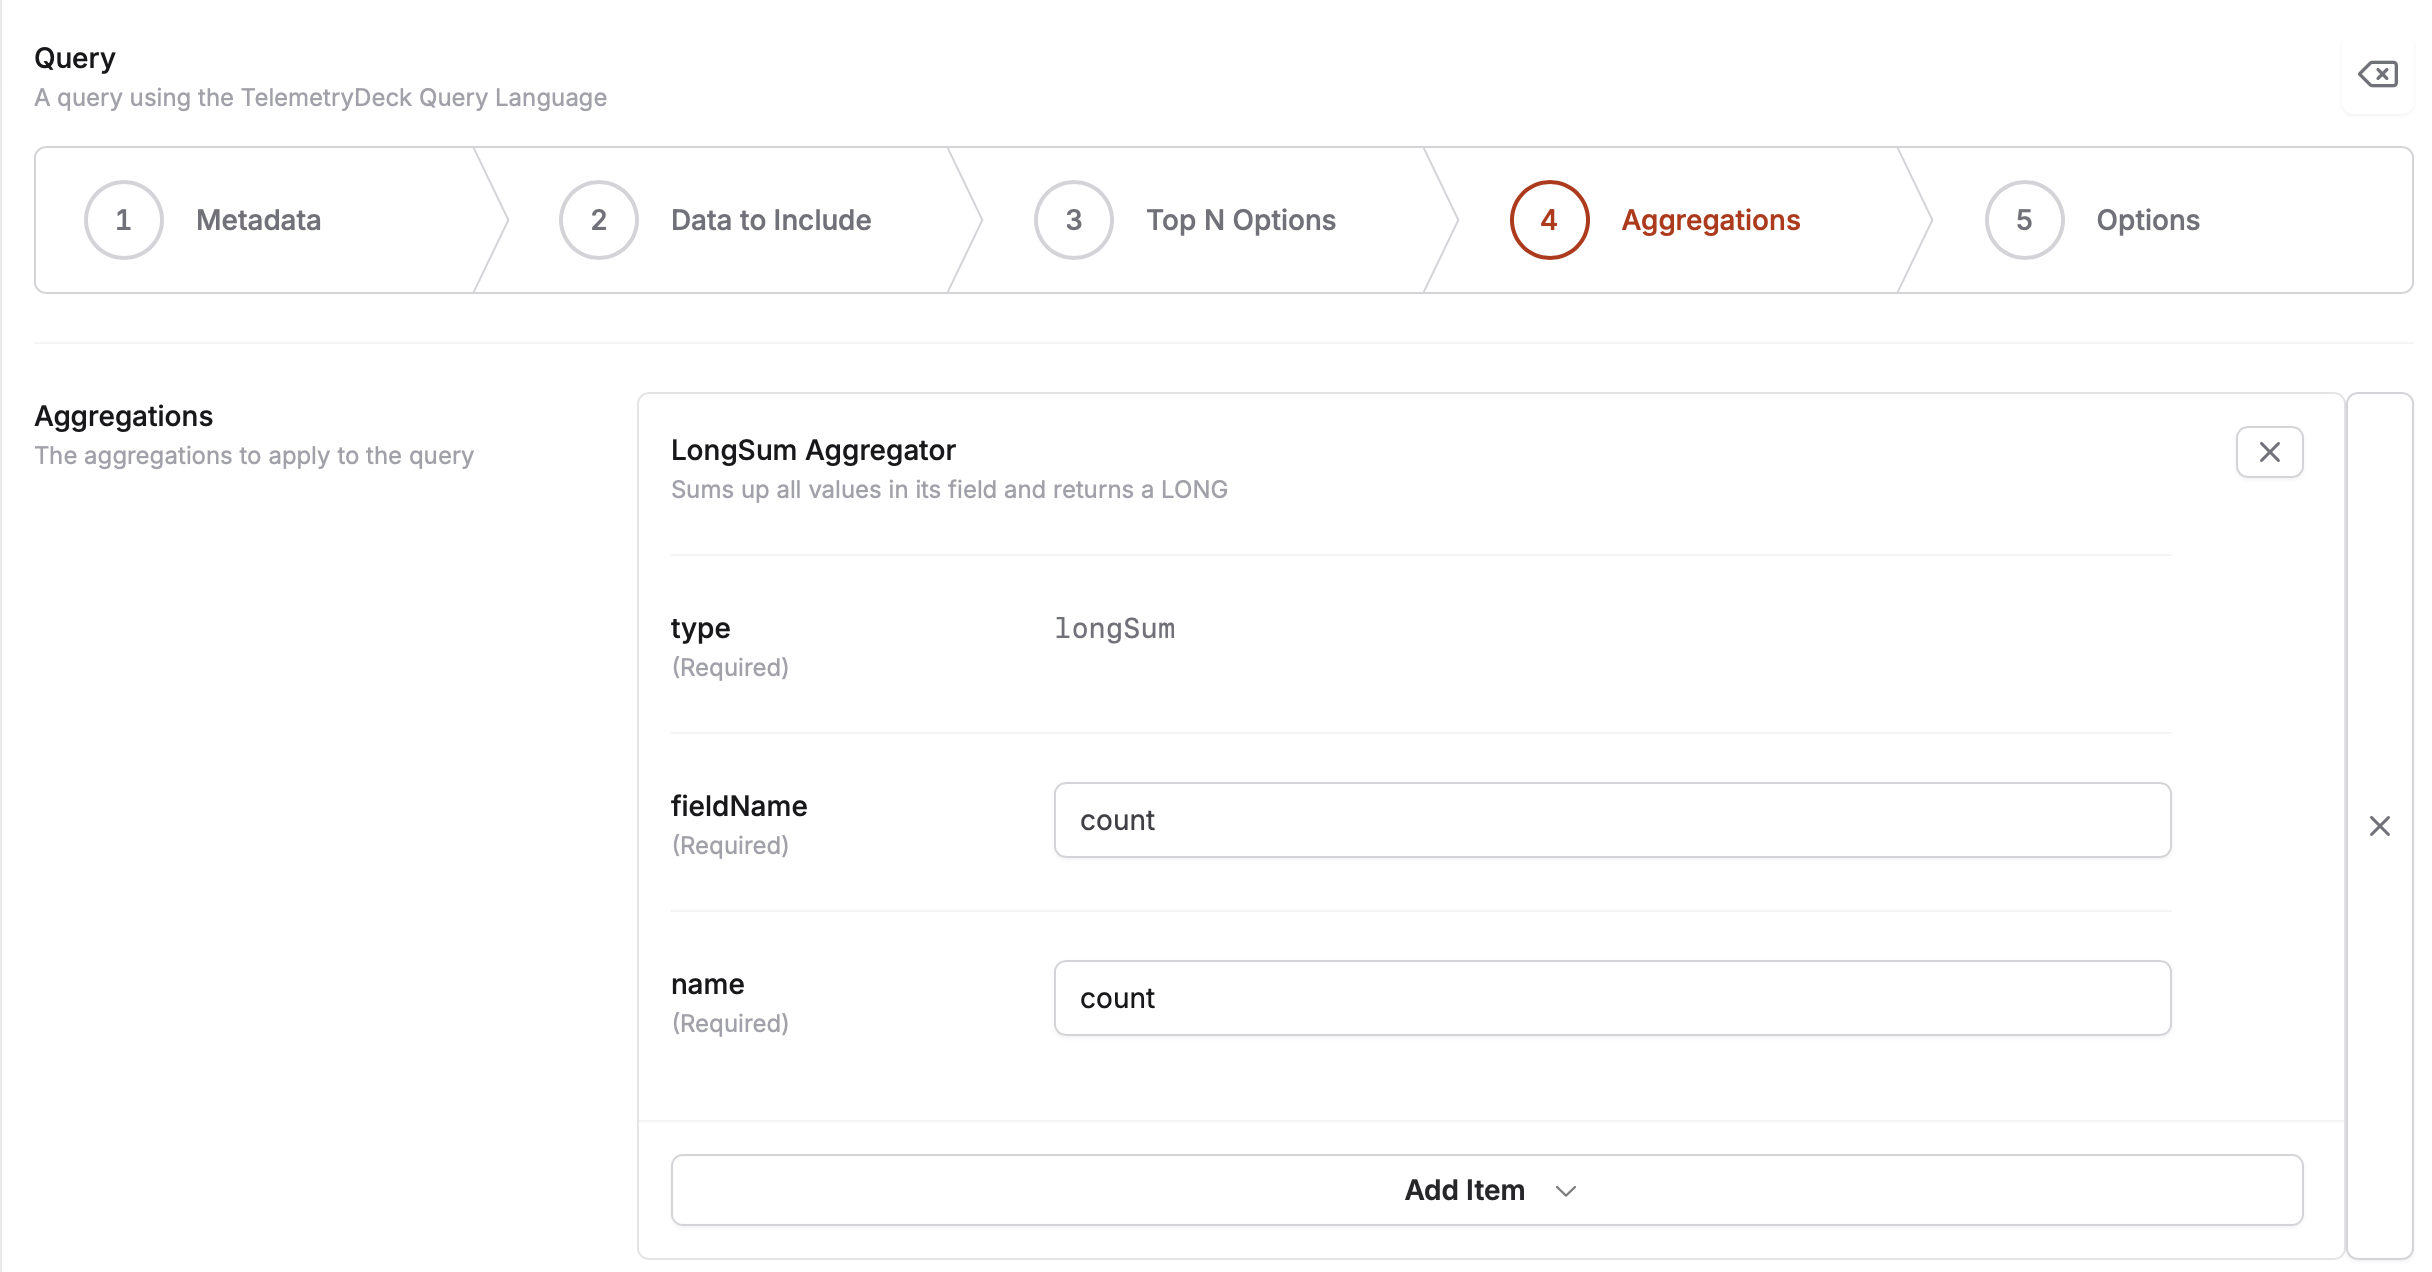
To wrap the creation of the insight up we recommend using a Donut Chart to display topN of the query results.
