
User churn and retention – these are the most important take-aways from our webinar
Daniel from TelemetryDeck and Pietro from Chatty Insights shared their knowledge on user churn and retention. Read our review of our March 2024 webinar here.


The fact that users leave your app after a certain period of time or greatly reduce their usage is a major concern for many app developers. We've taken a closer look at how to recognize user churn and retention in the usage data of an app and how to deal with the findings from the data.
This blog post is an extract of our Webinar with Chatty Insights that took place on March 11. You can view the recording on YouTube: User churn and how to prevent users from losing interest in your app
- How is user churn defined in mobile apps
- The last-straw action
- What is a good churn rate in a mobile app?
- Dealing with customer feedback
- How does adding a paid plan effect your user churn?
- How do retention charts work?
- Can you measure user churn and still protect user privacy?
- What did we as a company learn from this webinar
How is user churn defined in mobile apps
In our webinar, we first discussed the crucial concept of user churn. We found an interesting paradox: user churn cannot be measured directly, but its inverse – retention – can be.
Let's illustrate this with an example: Each month, we assess which users from the previous month or year are still actively using the app we are analyzing.
Iff that's 80%, then by deduction, we have a 20% churn rate. This percentage could be high or low, depending on your app. However, this is the approach to defining churn for a mobile app, particularly if it's a free app.
With a paid app, you can also measure whether people are actually actively canceling their plans. That's a more active action that happens too. With mobile apps however, we mostly look at usage retention.
The last-straw action
As a product owner, developer, or app creator, you typically have a deep understanding of how users engage with your app. Using data from sources like Chatty Insights and TelemetryDeck, you can build hypotheses and the later test them.
One thing we're looking out for is what we call al last-straw action: the last action or event that is happening before someone just stops using an app.
For instance, you might feel like most customers are churning due to a specific issue with, say creating new content in your app. To test this, you would focus on the area of your app related to that issue and start with the assumption that users who fail to create new content are more likely to to just leave.
To confirm this, you could examine the churn rate among users who failed to create new content. If the rate is significantly higher in this group, it suggests this feature needs improvement.
This approach can be extremely effective. In fact, we've seen it applied successfully in many apps across various industries.
What is a good churn rate in a mobile app?
Sometimes we examine these statistics and wonder, "Are we doing well? What's the industry average? What should we expect, particularly at different stages of an app?" For instance, in the beginning, you acquire early adopters from your community who are eager to provide feedback. Then, you gradually scale up to mass adoption, which may result in higher churn rates.
So, what is a good churn rate? We discussed some numbers, albeit vague ones. In mobile apps, these figures can be substantial depending on how you define churn. They also vary significantly across different app store categories.
Looking at free-to-play mobile games, we see some of the highest churn rates in the industry. In that sector, typical churn rates might be up to 80% to 95%. People often try out a game, decide it's not for them, and then move on without ever becoming a paying customer.
In freemium or free mobile apps, you can expect slightly lower but still high churn rates as users abandon your app. With a paid-up front mobile app, such as a productivity tool, a good churn rate could be around 10%, and an excellent rate would be 5%.
The best churn rate is, of course, no churn at all, but there will always be customers who leave for one reason or another.
Dealing with customer feedback
To fully understand a user's story, it's essential to ask about their experience and their thoughts on what should or could be changed. A significant insight we gained is: don't just do what users ask you to do. While every user or customer has an opinion, it's crucial to delve deeper to understand the underlying issues or pain points influencing these opinions. These could be positive or negative.
Maybe run a small experiment based on a hypothesis drawn from this feedback. This could involve making a change for a small group of users, conducting an A/B test, and collecting more data.
Interact with your users, customers, and team, test ideas, measure results, and adjust accordingly. Strong analytics are vital for tracking user behavior and understanding why they behave in certain ways.
Understanding why people are leaving is as important as knowing the behaviors leading them to that point.
How does adding a paid plan effect your user churn?
During the webinar, we received a query from one of our participants that likely concerns many app developers:
"I have an app for runners, which used to be completely free. However, I've recently implemented a one-time purchase paywall. What common pitfalls or churn do you see from altering business models in this way?"
A significant concern is that some users may be upset because something that was previously free is no longer so; this reaction is entirely expected and normal.
Additionally, it's important to understand that this will be a process. Your pricing strategy, or how you ask your customers for money, isn't a permanent decision. Just because you make a decision now doesn't mean you have to stick with it indefinitely. Perhaps you discover that the paywall's placement works, but the price doesn't. In this case, you can adjust the price, or vice versa.
Making data-driven decisions is excellent, but remember that all data-driven decisions are based on the data available at the moment. You'll never have complete data until everything is done.
So feel free to experiment, gather data, test some more, and release new versions as often as necessary. It's vital to experiment with your pricing and payment strategies as part of the process. It's all super exciting, and it's going to be okay.
How do retention charts work?
It is important to understand the charts where you can read retention. This the most important chart we looked at in the webinar:
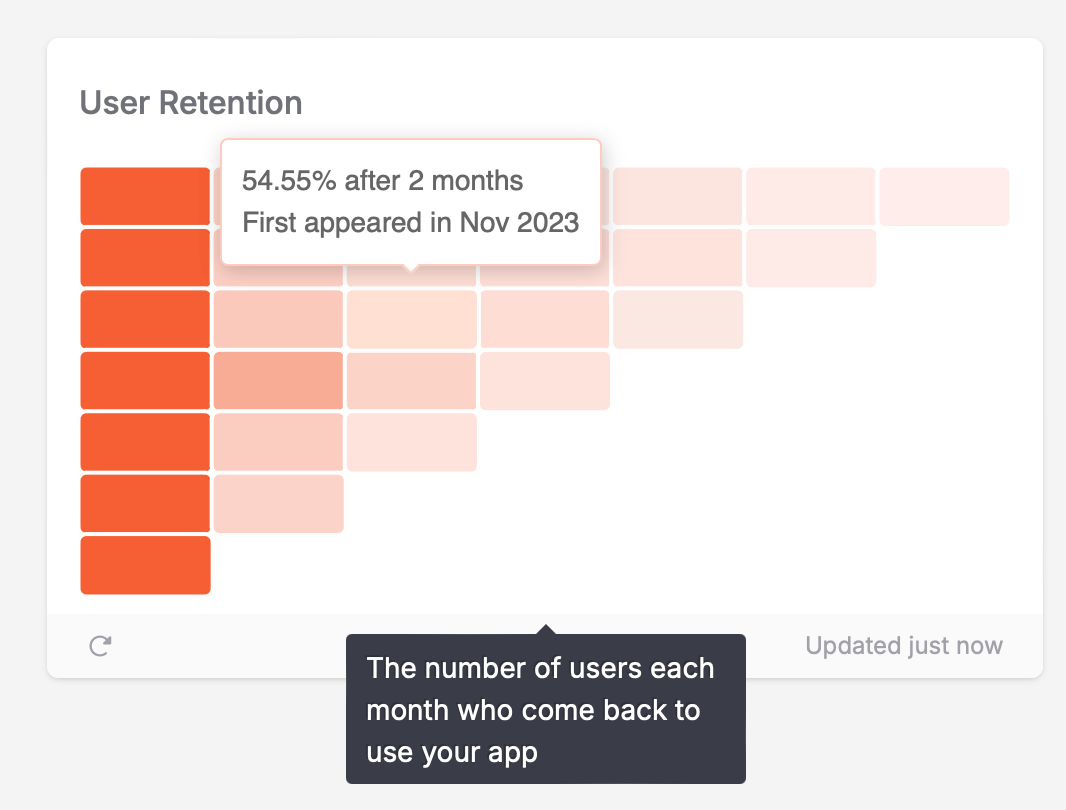
The chart visualizes user retention over time, with each row representing a starting month and each column representing a subsequent month. Look at the row for November and see how the boxes get lighter over time as users drop off. This app loses about half its users after 2 months.
Retention stabilizes after the first month, with decreasing drop-off rates. Analyzing different app versions can show you whether changes lead to longer user retention or increased drop-off. This approach provides a quick way to evaluate changes without A/B testing.
Can you measure user churn and still protect user privacy?
It is indeed possible to reduce churn in a manner that respects privacy. It's also possible to track user retention without explicit consent, taking into account privacy considerations.
For example, using stable, randomly-generated identifiers, TelemetryDeck can track a user's activity as long as they don't uninstall their app. This approach is compliant with GDPR and other data privacy laws.
We may not know the user's identity, but we can determine if they are the same individual who visited the day before. This is sufficient for calculating retention and churn rates. If user 123 visited yesterday and returned today, we know we've retained that user. If not, we know we've lost them.
What did we as a company learn from this webinar
We liked offering useful content for our customers on cooperation with other companies. This way you get to know great new services, and we can expand our target group - without a large marketing budget (a large marketing budget? In this economy?). So we'll try doing webinars again in the future about topics that are cool and fun and interesting. Let us know if you have a topic in mind!
What we will definitely pay more attention to next time is the imagery and graphics. We have received very helpful feedback and have adapted our imagery accordingly. What we didn't notice, however, were the legs of the woman in the high heels, which were constantly peeking out from behind one of the speaker videos during the webinar. We apologize for that.
Never miss a webinar again and subscribe to our newsletter to get all the latest insights app developers need to know.