
How to recreate 2022 Wrapped for your App using TelemetryDeck
End of year wrapped features like Spotify Wrapped are a fun way of visualizing users’ listening patterns and preferences, and they’re is so wonderfully shareable too. If you want to do the same, you’ll have to start gathering data by January 1. Here’s how:


This article will provide a quick guide on how to replicate the popular Spotify Wrapped feature for your app using TelemetryDeck app analytics. In this example, we will focus on a fictional podcast app and collecting data on how many seconds the user has listened.
To do this, we will be using the new floatValue field to send accumulated listening seconds. We can later aggregate the data to get cool displays for each individual user. With this method, users will be able to see how much time they've dedicated to your app, and compare it with other users.
Previously, the TelemetryDeck API only supported String values, in your payload. These are easy to manage, they’re type safe, and you can fun breakdowns and distributions on them. With our recent addition of the floatValue field, you can now send one numerical value per signal as well, and one really cool way to use this is collecting data that needs to be mathematically aggregated later, data where you want to know the sum, the minimum, the average, etc.
So let’s use that ability. In our
Prerequisites
This article assumes you’ve already integrated the TelemetryDeck SDK into your app. You also need to update to the lastest version of the SDK (Swift SDK 1.4.0) to be able to send numerical values. Once this is done, you will be able to start collecting aggregated data about your users.
Tracking Listening Times
The most viable option for tracking the time a user has listened to a podcast is this, in my opinion:
- When a podcast starts playing, store a timestamp in memory
- Listen for any event that stops the playback, such as app quit, pressing pause, or any similar events.
- In that event, calculate the number of seconds the podcast was playing
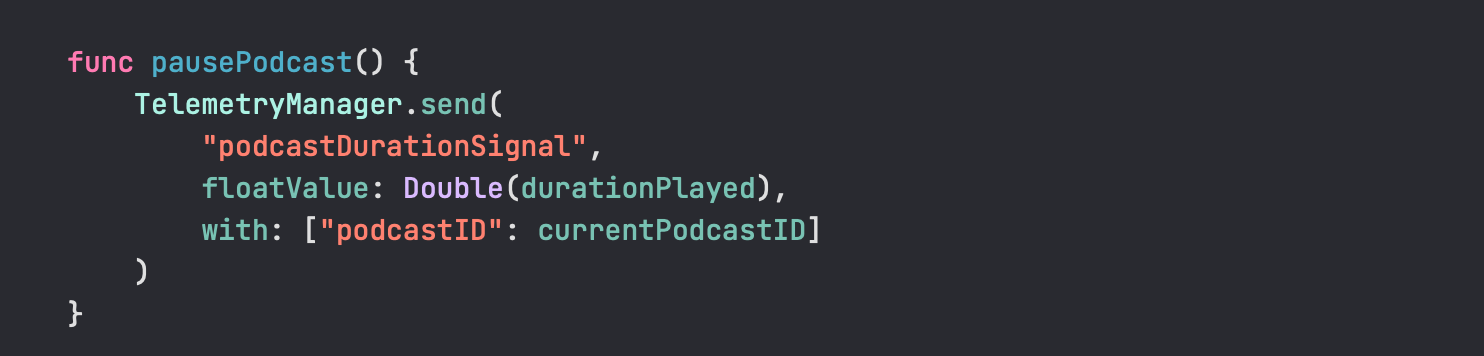
- And send signal to TelemetryDeck like so:
- signal type: podcastDurationSignal
- payload: [”podcastID”: ABCDEF]
- floatValue: (the number of seconds you just calculated)
This will record all listening times for each individual podcast and user on TelemetryDeck, allowing you a wealth of data to aggregate later:
- You’ll be able to track all listening seconds for all users on all podcasts
- You can find the most listened-to podcasts
- And you can even create breakdowns for each individual user regarding overall listening time and listening time per podcast.
Once this is done, you can start to present the data in a cool and exciting way that users will love.
With this method, you will be able to replicate the popular Spotify Wrapped feature for your app using TelemetryDeck app analytics. Users will be able to see how much time they've dedicated to your app, and compare it with other users.
Wrap the year inside your app
At the end of the year, you can use the Query API to retrieve the data you've gathered and generate a nice in-app visualization. To do this you;ll need to
- Identify the TelemetryDeck ID for your user (this might have privacy implications: you might have to ask for permission once)
- Run a query for the aggregated user data against the TelemetryDeck API
- Display the data in your own beautiful way
I intend to write a follow-up to this post with more information about these topics later in the year. As long as you start to collect the data soon enough, you're golden.
Other uses for numerical data
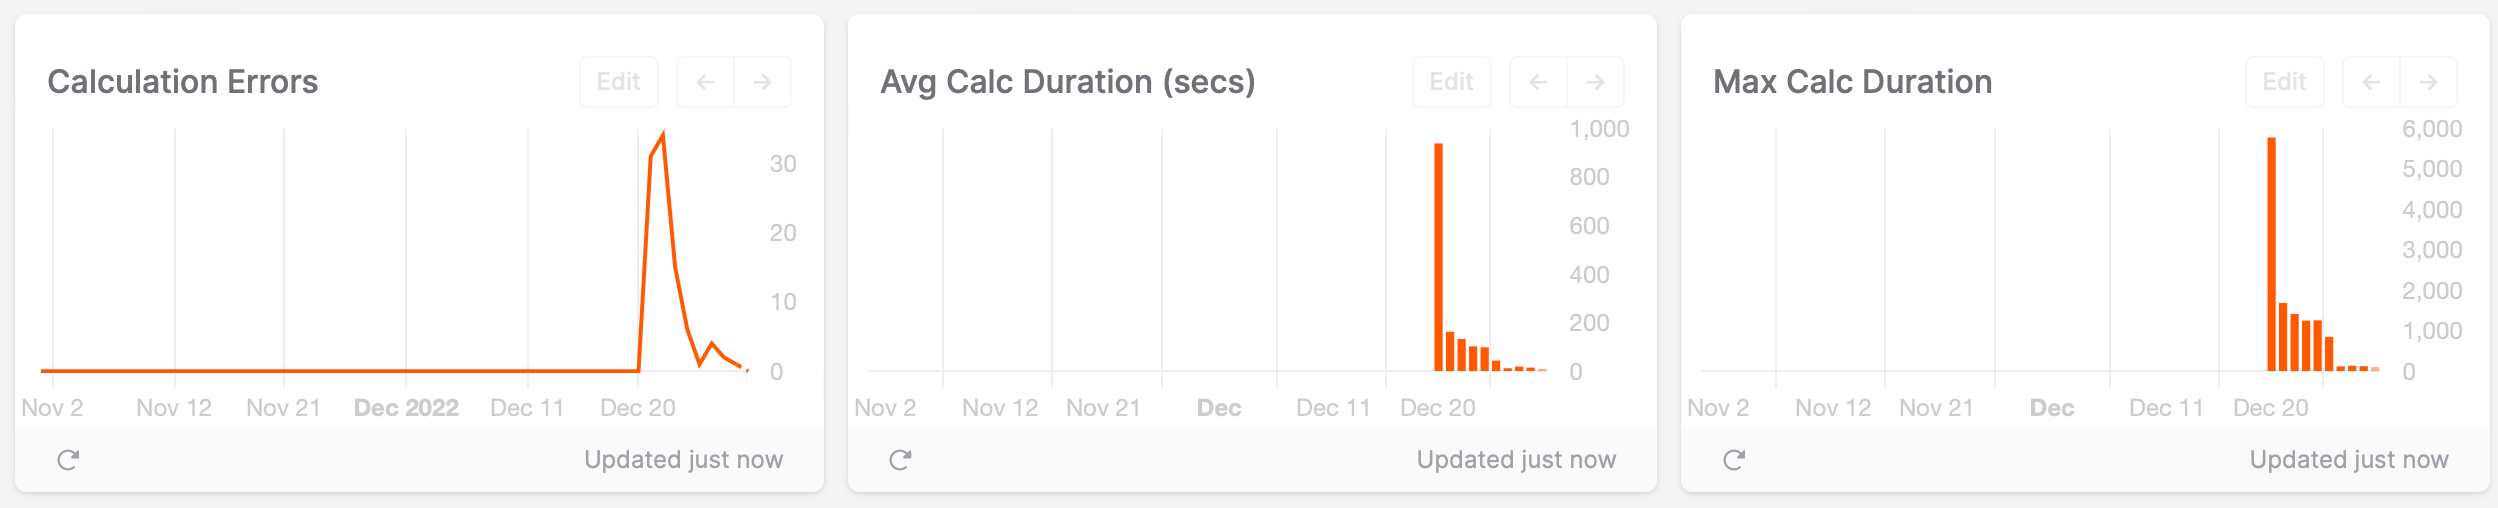
Aggregating numerical data has lots of use cases of course.
- Track average performance or loading times of your app or parts of your app
- Find out how much time users are spending in specific parts of your application
- Learn the maximum or minimum number of database entries people have in a local database
Right now you'll have to write some custom TQL code to run aggregations like "average" or max on your data, but we're hard at work on the Insight Editor to allow you to do that in a more convenient way!
Hopefully this guide has helped you learn how to collect numerical data for your app and e.g. replicate Wrapped using TelemetryDeck app analytics. Enjoy using this new feature and we can’t wait to see what you build with it 😊