

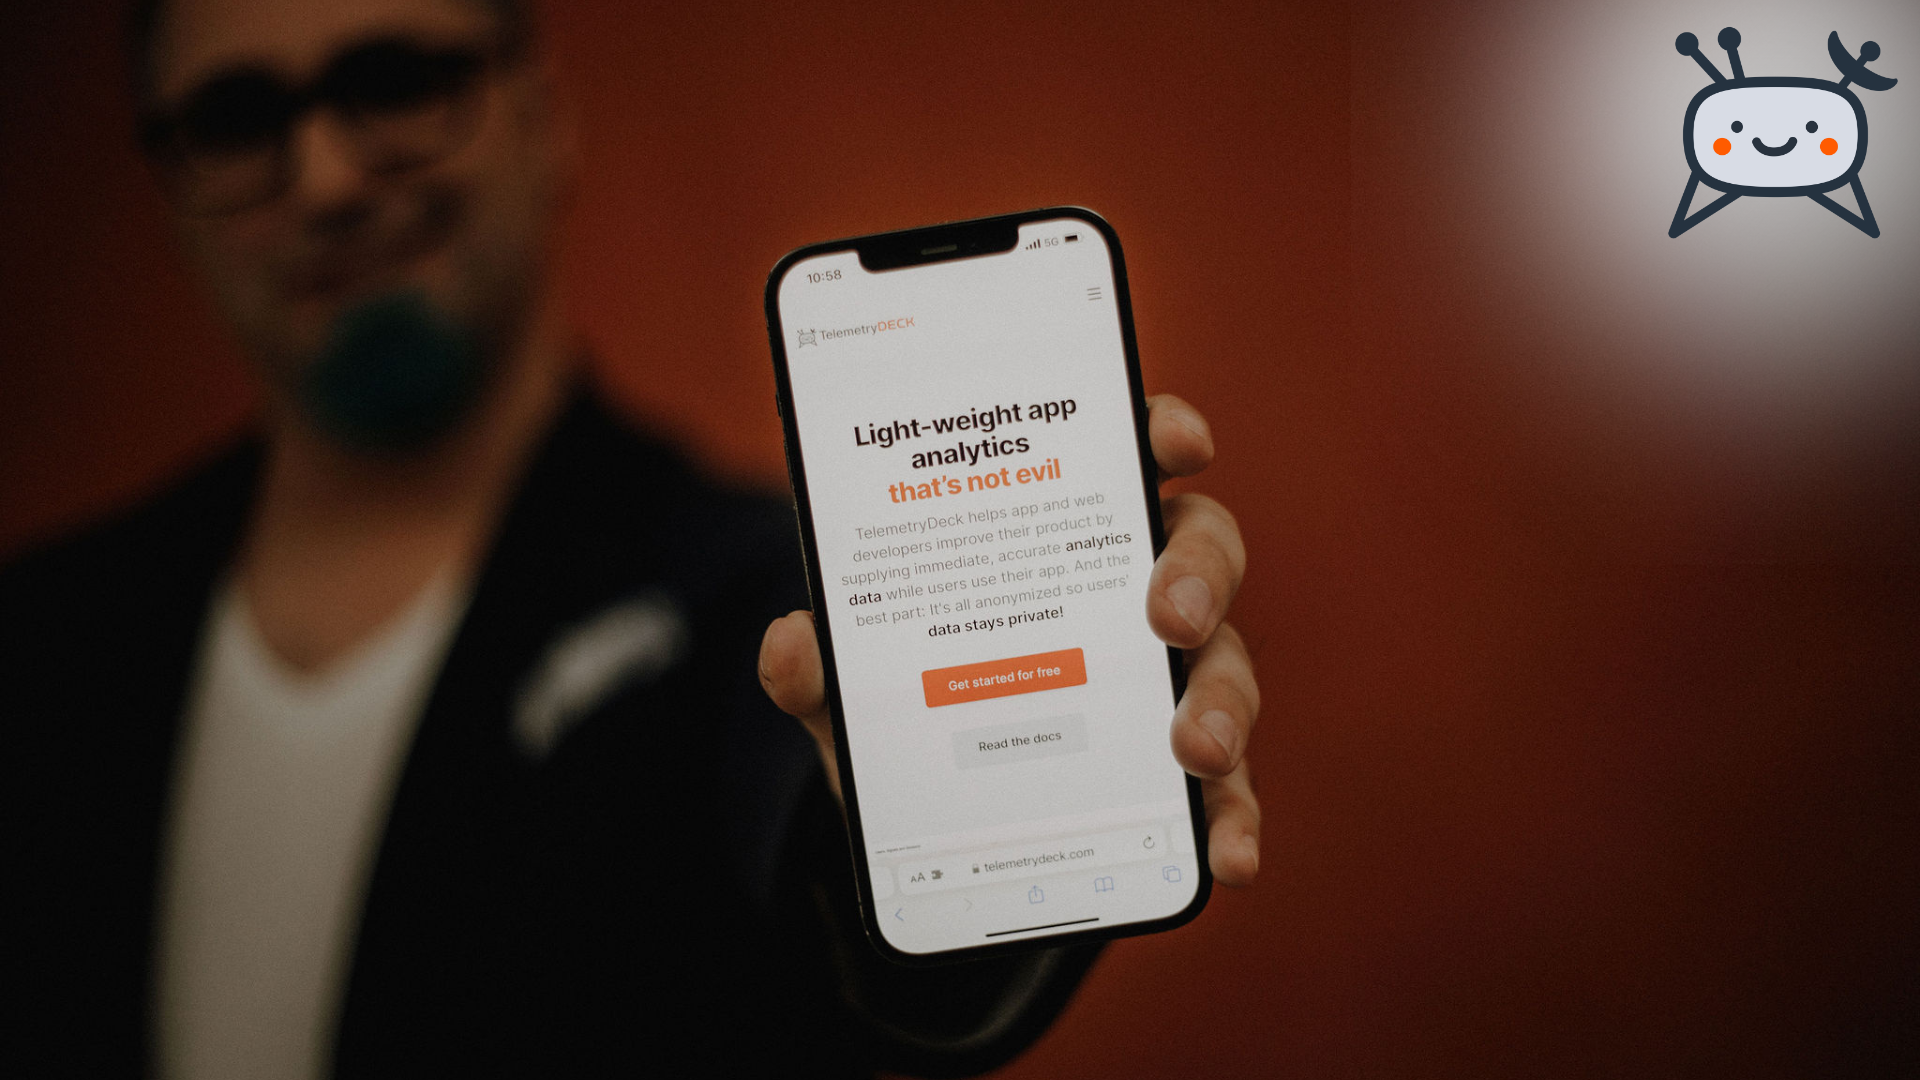
All the data you need, none of the hassle with GDPR
Cookieless Tracking with TelemetryDeck
Our cookieless tracking analytics solution is a crucial tool for website owners who need insightful data while staying fully GDPR compliant.
What is cookieless tracking? It's an emerging method of gathering web analytics data without relying on cookies. Because cookies are specifically mentioned in GPDR, DSGVO, CCPA and other privacy laws, a cookieless tracking solution can often gather better data, especially when combined with strong privacy protection.
How does cookieless tracking work? TelemetryDeck's web analytics will combine the your website's unique app identifier, the date, an optional salt and parts of the visitor IP address and then scramble that into a hashed identifier. This is unique to visitors to your site, but contains no connection to any real persons.
- Cookieless Tracking.
- We do not store any data at all in cookies so you don't have to show annoying cookie banners or deal with GDPR hassle.
Paste & Go
30 second setup
Including TelemetryDeck into your website is quick and easy – just paste this one line into your websites header element and you're done.
Try it out now and let us know how long you took!
<script
  src="https://cdn.telemetrydeck.com/websdk/telemetrydeck.min.js"
  data-app-id="<YOUR APP ID>"
></script>
TelemetryDeck is awesome for the web


Most Read Articles
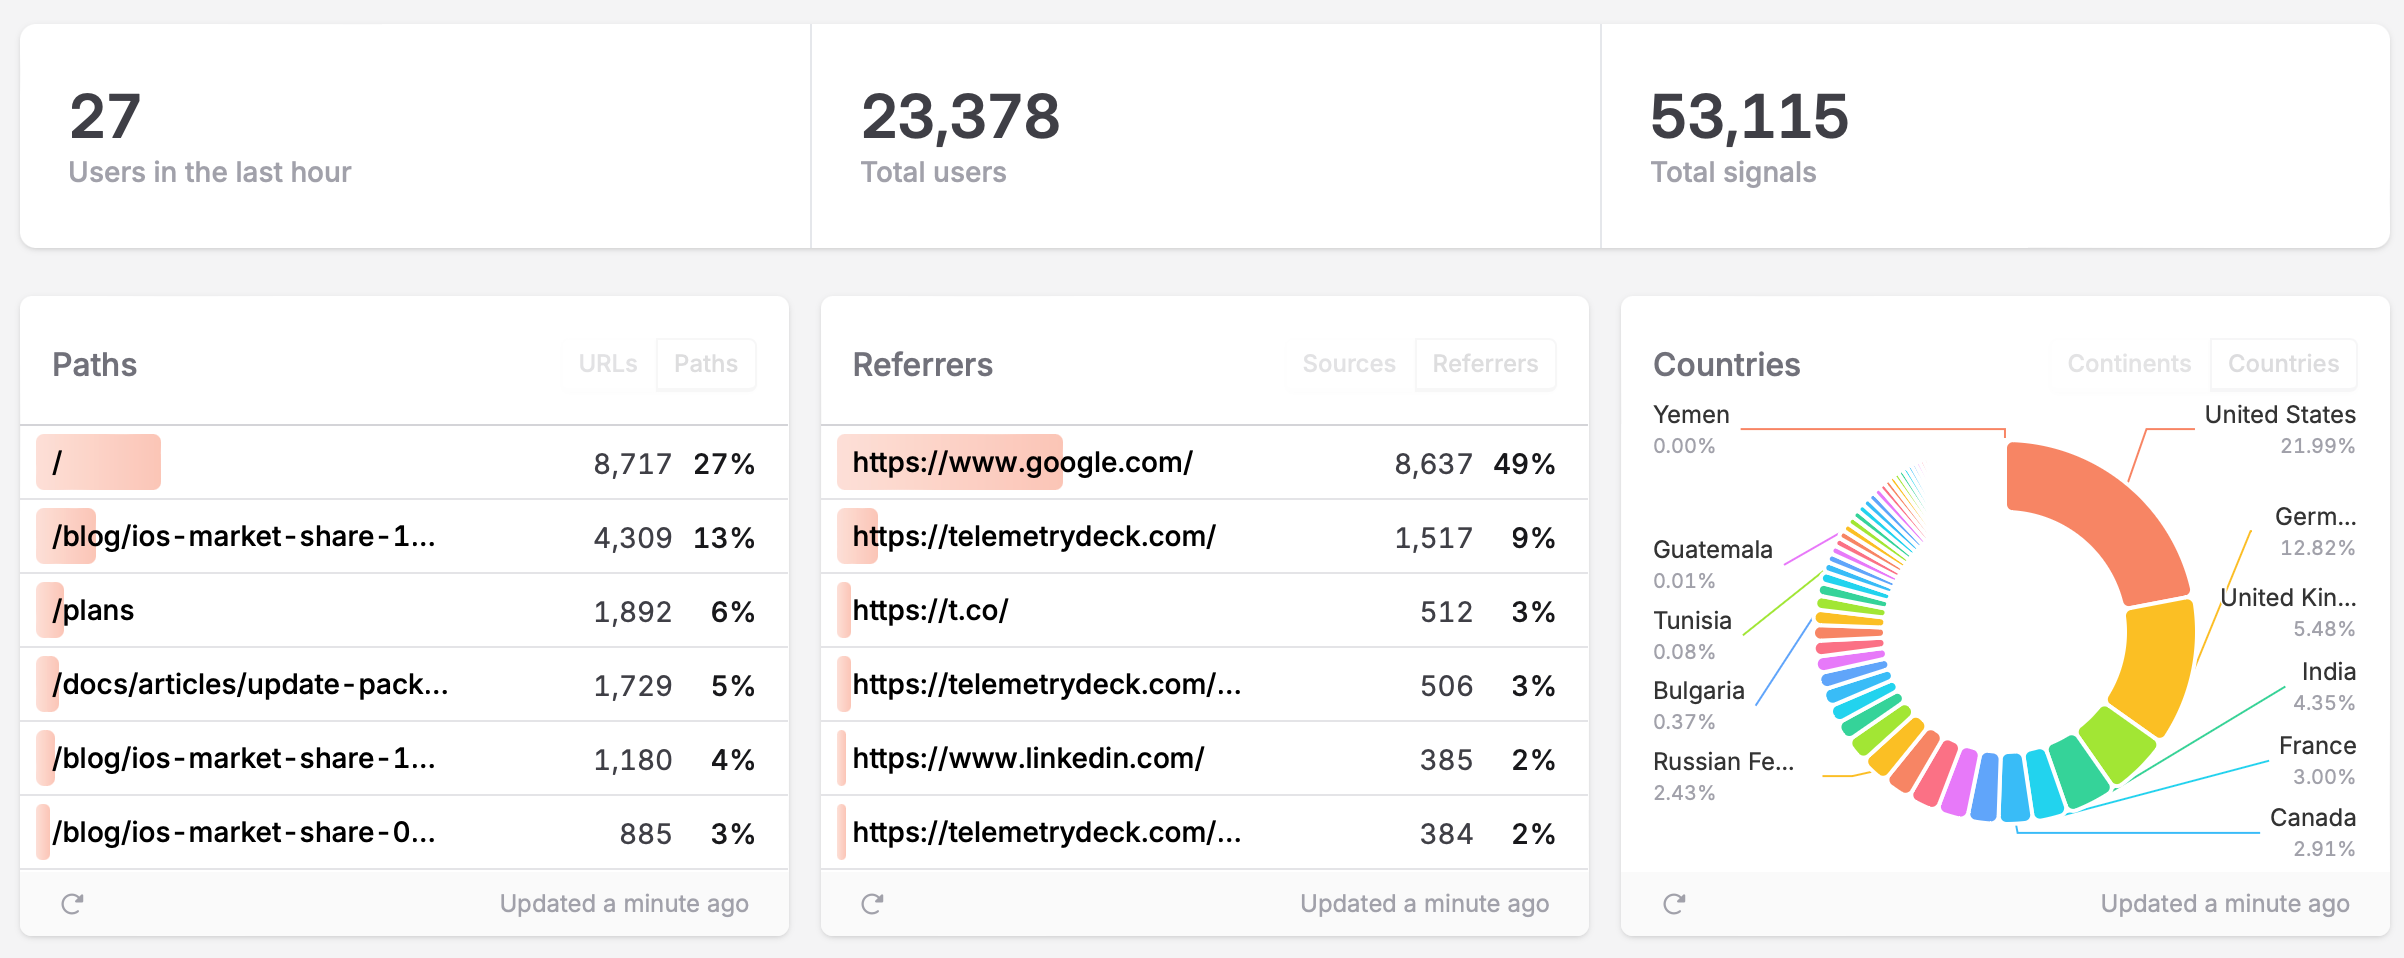
Visitor numbers, paths, countries and traffic sources
The data you need to succeed
To make your content and presentation awesome, you need to know how your visitors move around the web and reach your page. Let us show you!
TelemetryDeck will automatically collect anonymized visitor data such as
- Which sites does your traffic come from?
- Which pages are visited most?
- What browsers are people using?
- Where in the world are your visitors coming from?
And show you in automatically generated overviews and charts.
Let's talk about Cookie Consent Banners
Cookie banners are ugly, interrupt user experience and flow, and destroy your visitors' trust in your organization. Wouldn't you rather skip them and still be compliant with privacy laws?
You can, with TelemetryDeck.
Meet our amazing customers
These Websites trust TelemetryDeck
Check out these amazing developers who added cookieless tracking with TelemetryDeck to their website.
Cookieless web tracking is a respectful way of monitoring user behavior online. We asked some of our customers about their experience with the privacy-focused web tracking service from TelemetryDeck.
Visit our article about web tracking with TelemetryDeck
Forget consent management
100% GDPR Compatible
We've done all the hard work to ensure that you can sleep easily.
TelemetryDeck complies with all data privacy laws that we know of, because it takes pains not to collect any personally identifiable information or PII.
This is why you don't need to show cookie banners. You also won't need to update your privacy policy to use TelemetryDeck. And if you need a Data Processing Agreement for compliance's sake, we have that, but most of our customers don't need that.
