
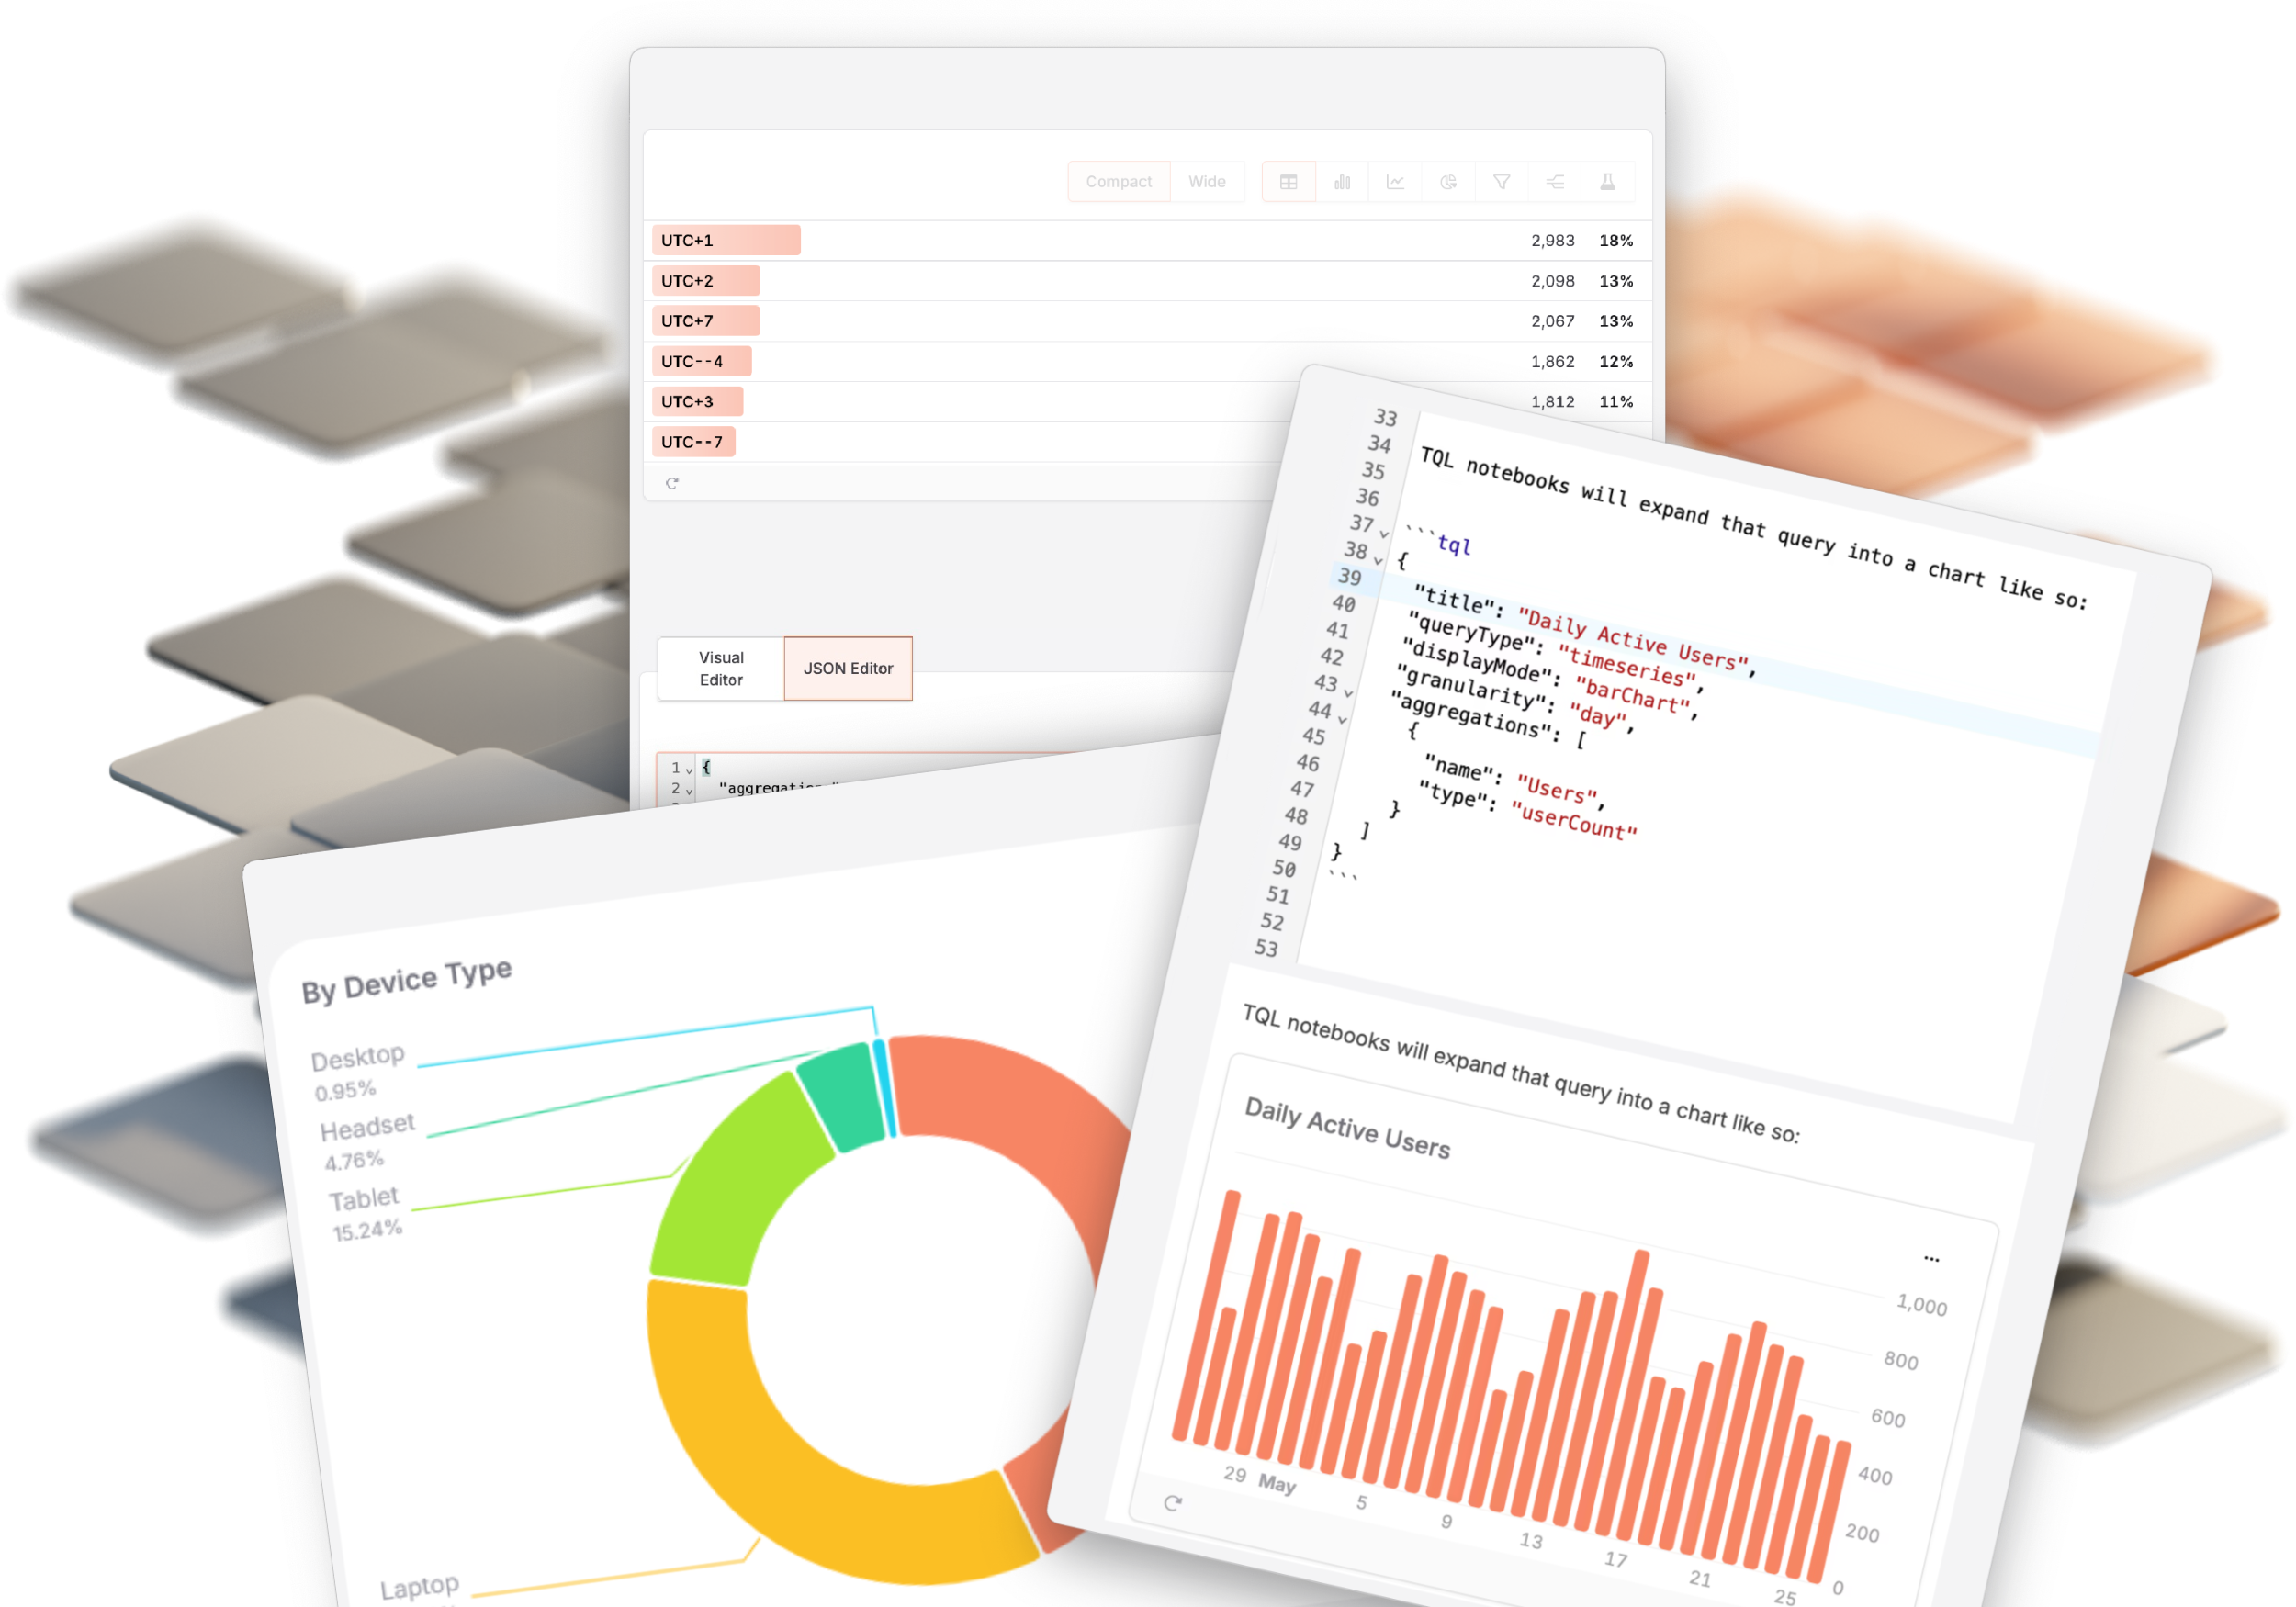
Share analytics dashboards like code files
Export and import Custom Dashboards with smart field mapping. Share setups across apps, with teams, or in tutorials.

Ever spent an hour recreating a dashboard in a different app? Or watched someone demo an analytics setup and wished you could just copy it instead of rebuilding everything from scratch?
What if dashboards worked like code files? Export a configuration, share it, and import it elsewhere with intelligent field mapping that handles naming differences automatically.
That's exactly what we've built: Custom Dashboards can now be exported and imported with smart field mapping built in.
Why is importing and exporting analytics dashboards helpful for you?
Use it across your own apps to save time. You've built the perfect onboarding funnel dashboard in your iOS app. Now you're launching an Android version – export the dashboard, import it with adjusted field names, and you're done. What used to take an afternoon now takes a few minutes.
Share proven setups with your team. Your teammate figured out an excellent retention analysis dashboard. They export it, you import it. Everyone gets the same proven analytics setup without manual recreation or explaining over Slack.
Content creators: Share actual working examples. Writing a book about app analytics? Creating a tutorial course? Export your tracking dashboards and include them with your content. Your readers or viewers can import the actual working setup instead of trying to recreate it from screenshots.
Be an active part of the app developer community –share your knowledge and learn from others: You built a clever way to analyze user behavior or track A/B test results? Export it and share with the TelemetryDeck community. Help others skip the trial-and-error phase.
How it works: Export
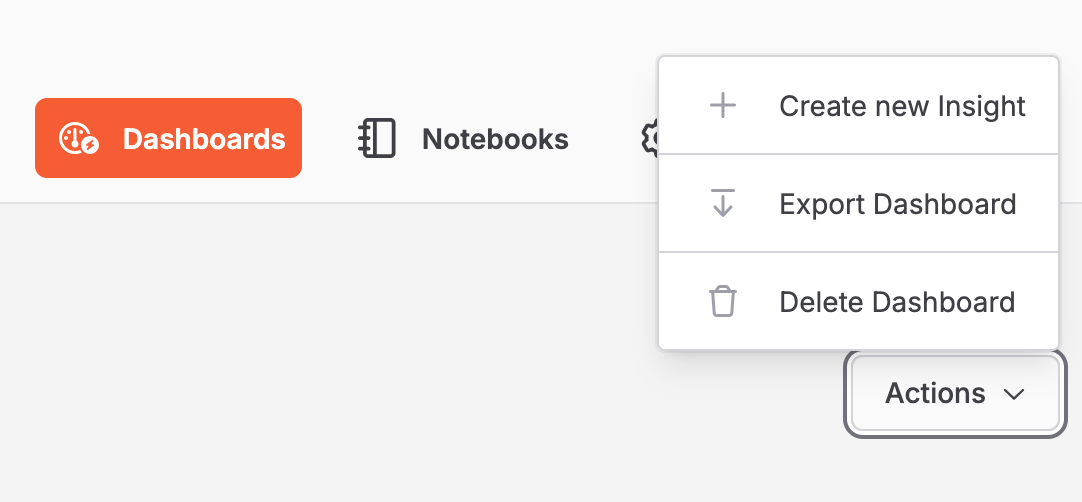
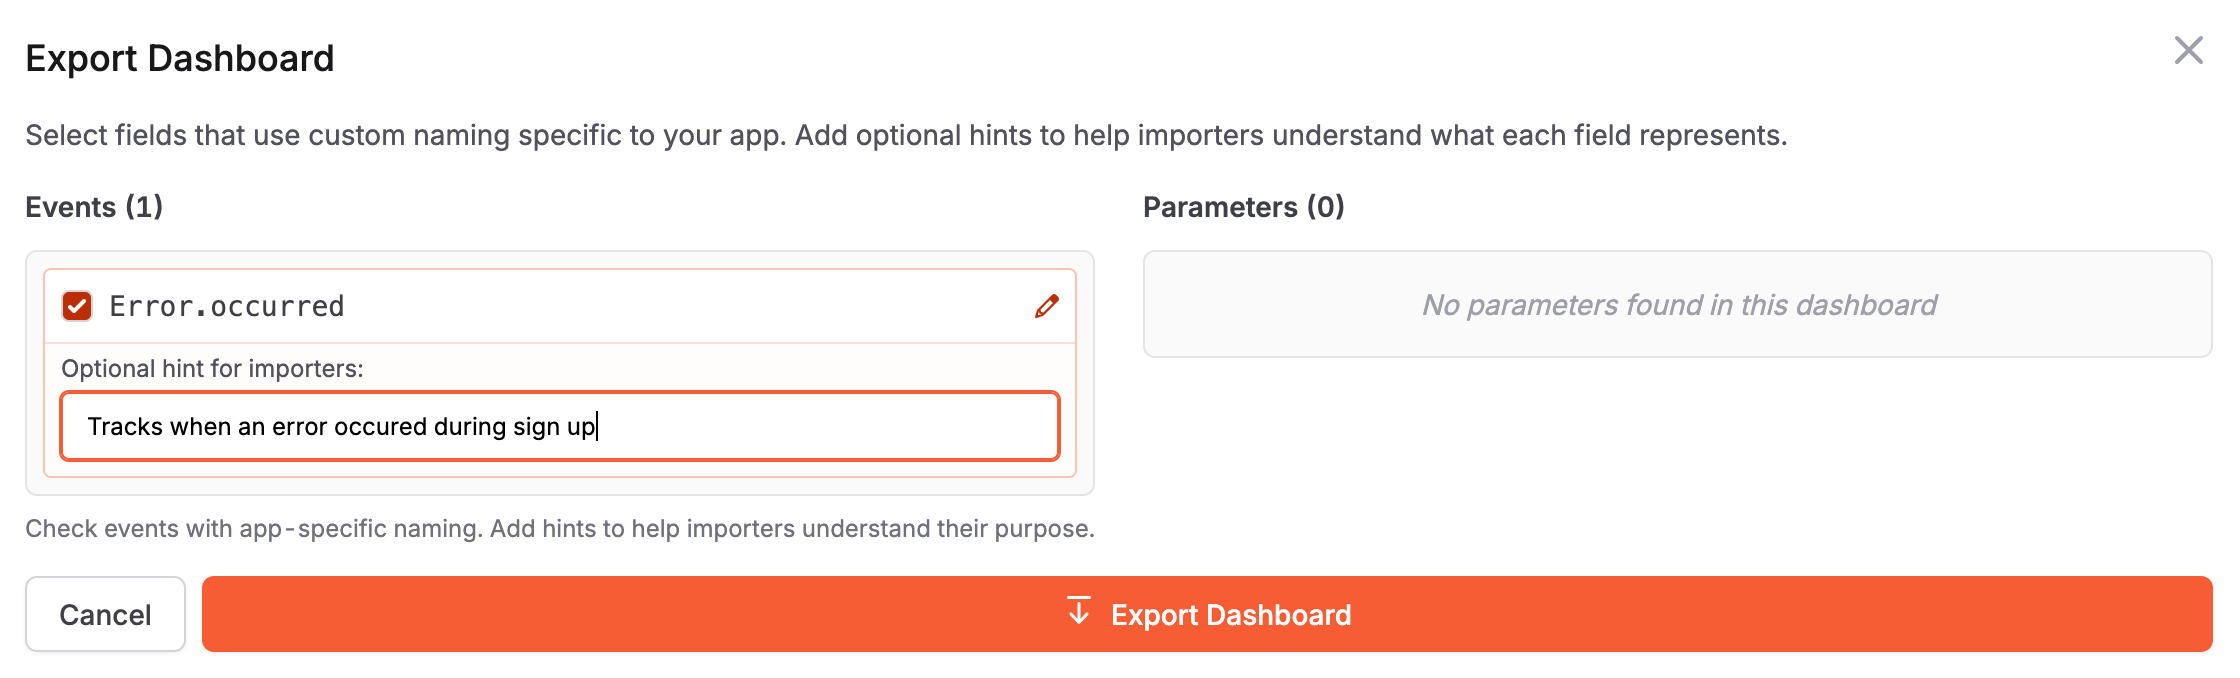
Open any Custom Dashboard, click Actions in the top-right corner, and select "Export Dashboard." You'll see all the events and parameters used in that dashboard.
Here's where it gets smart: mark which fields are app-specific and add hints to help importers understand them. For example, if your dashboard uses "checkout.completed" to track purchases, mark that field and add a hint: "Sent when payment processing finishes successfully." When someone imports your dashboard, they'll see your explanation and can map it to whatever they call the same event.
Click Export, and you get a JSON file ready to share – via email, in a GitHub repo, posted in community forums, or included with tutorial materials.
How it works: Import
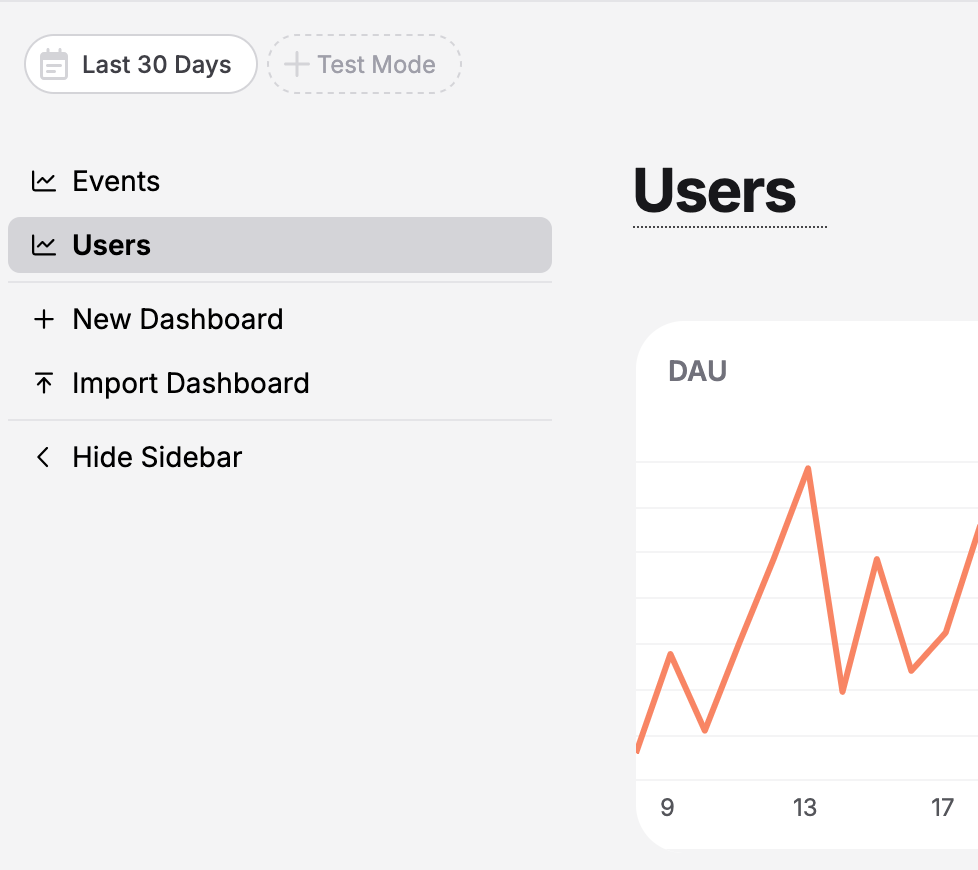
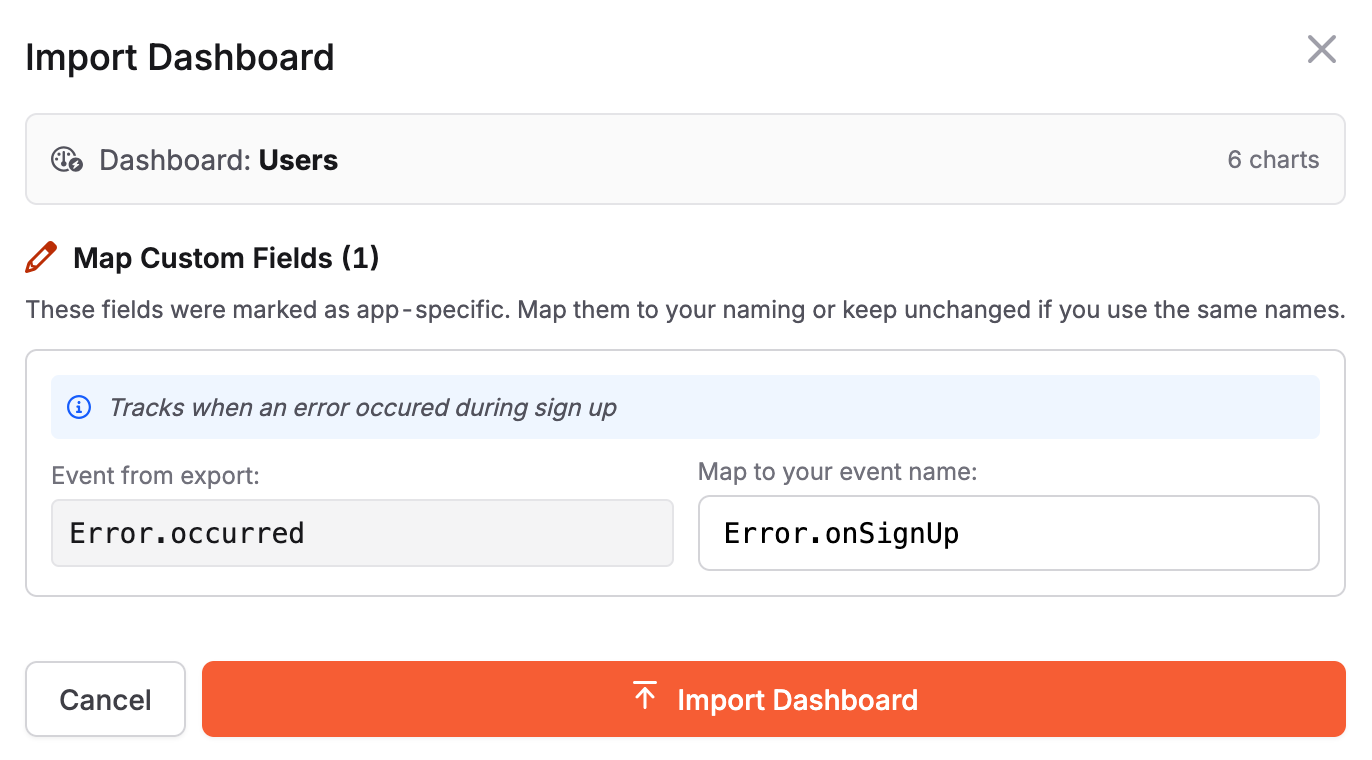
In your Custom Dashboards section, click "Import Dashboard" in the sidebar and upload a JSON file.
If the creator marked fields as app-specific, you'll see them prominently with their hints. The interface shows "from export → map to your name" side-by-side. Don't use the same naming conventions? No problem. The system handles everything – filters, funnels, breakdowns, aggregations – all updated automatically based on your field mappings.
Smart features under the hood
The system is built to be intelligent:
- Automatically filters out TelemetryDeck's 60+ built-in events and parameters – you don't need to map standard fields
- Preserves chart order and all query complexity – funnels, custom TQL queries, everything transfers perfectly
- Defaults to identity mapping – if you use the same names, you don't need to change anything
- Handles edge cases – complex nested queries, aggregations, filters all work seamlessly
Try it yourself
The easiest way to understand how this works: export one of your existing Custom Dashboards and import it to a different app. Even if you use the same field names, you'll see the import flow and understand how mapping works.
If you create educational content, tutorials, or documentation about analytics, consider exporting your dashboards and sharing them alongside your content. Your audience will appreciate working examples over screenshots.
We're also working on including exported dashboards in our own video tutorials and documentation – so you can import the same setups we demonstrate. But the real power here is what you'll build and share with your own community.
Happy analyzing! 📊