#docs #basics #setup #basics #analytics
Analytics Overview
TelemetryDeck's dashboard is organized into intuitive sections that help you understand how users interact with your app. This guide walks you through each part of the interface.
Dashboard navigation
After integrating the TelemetryDeck SDK into your app, your data will start appearing in the TelemetryDeck dashboard. The main navigation tabs help you find different types of insights:

Let’s explore what you’ll find in each section:
Overview
The Overview tab provides a high-level summary of your app’s performance, showing key metrics like daily active users, total users, user retention, app version distribution, and system version distribution:
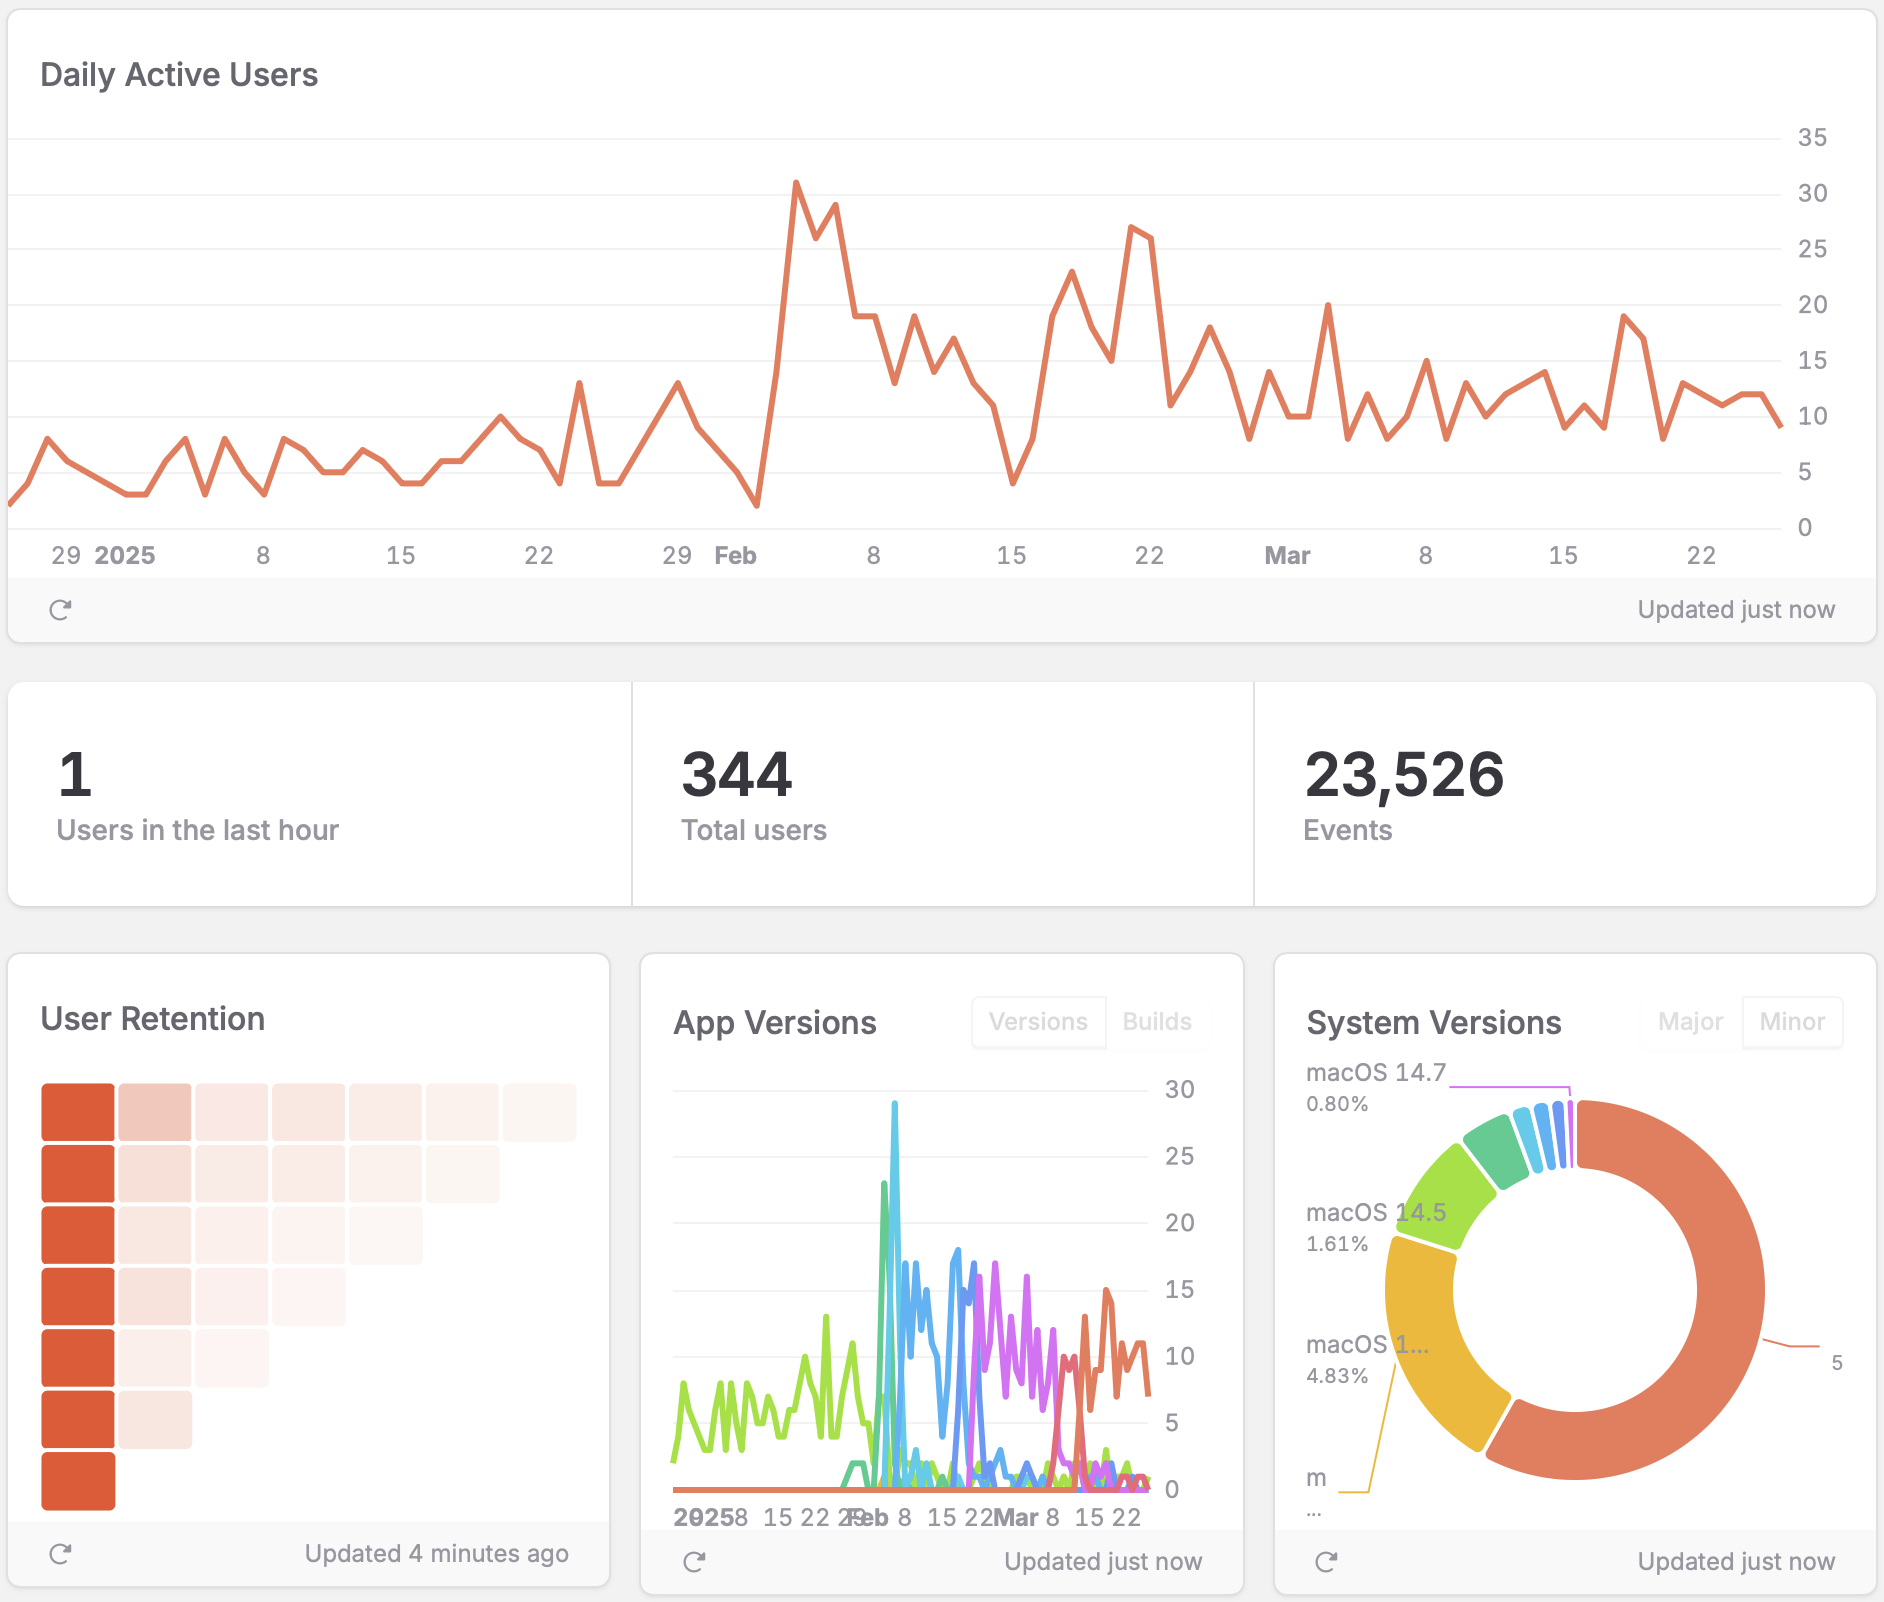
This view gives you immediate answers to: “How is my app performing right now?” and “Are my users upgrading to new versions?”
Customers (User Analytics)
The Customers section organizes your user data according to the journey users take with your app, from discovery to monetization:
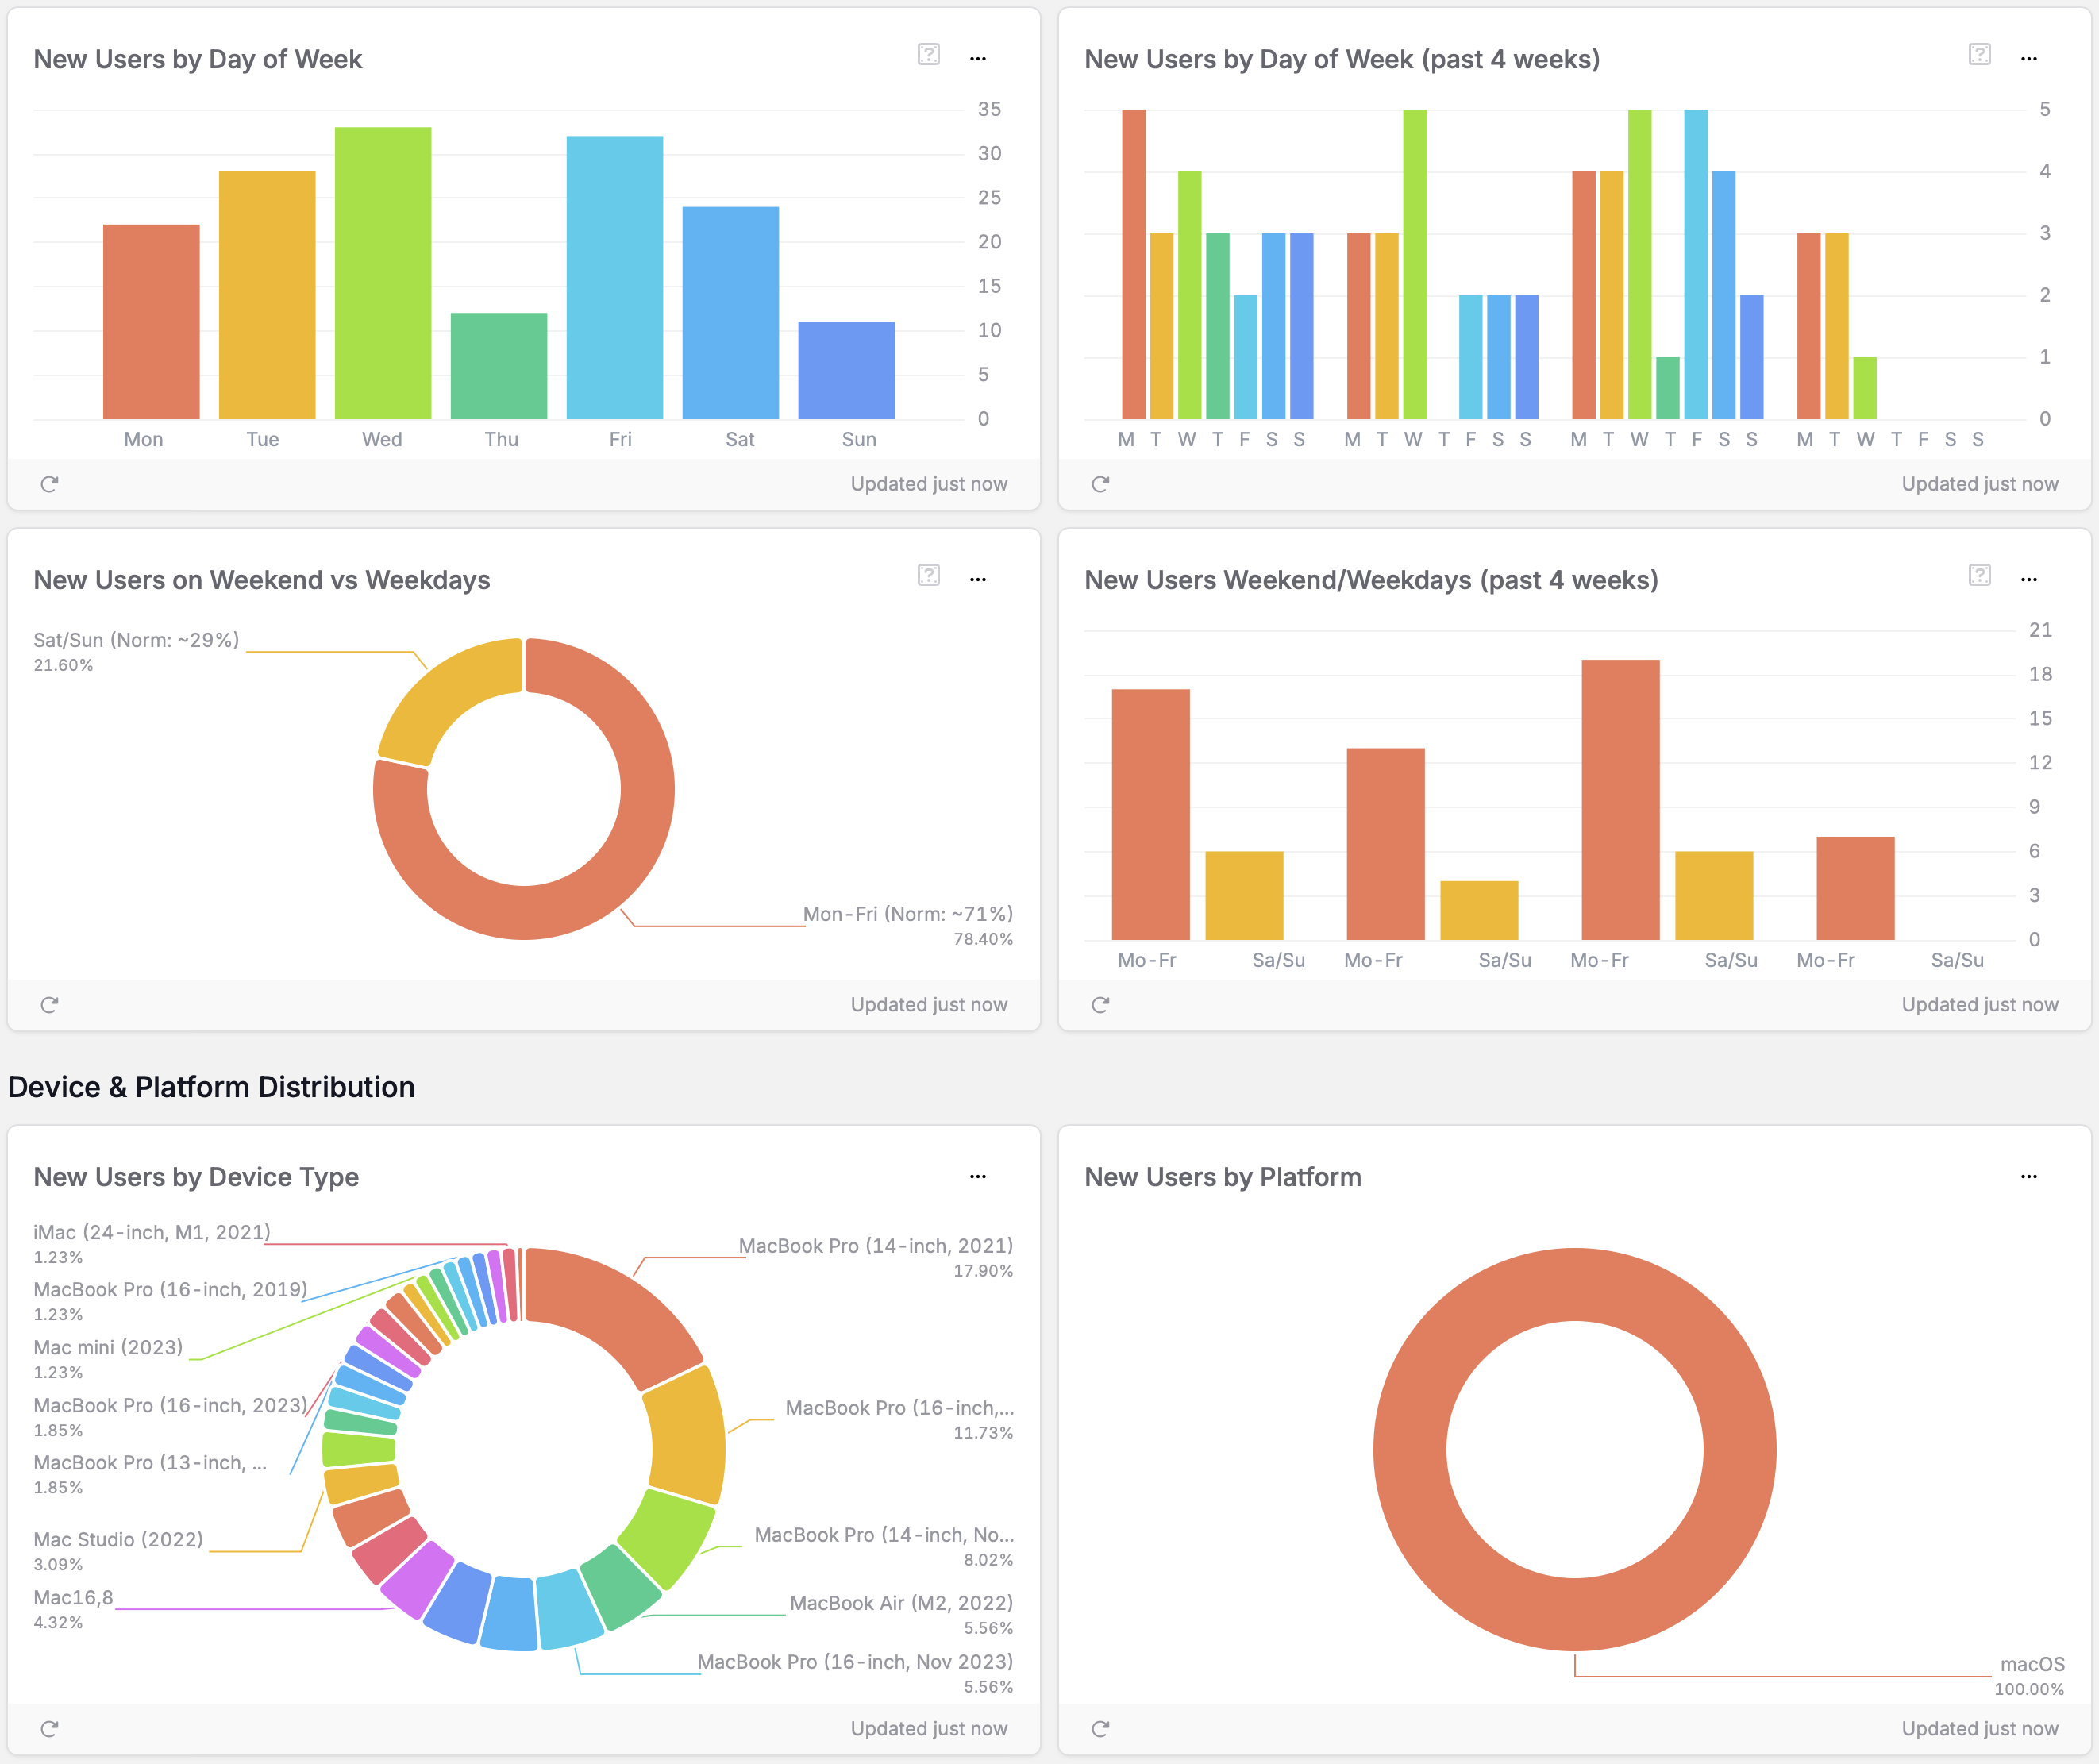
Each tab focuses on a different stage of the user journey:
Acquisition tracks how users find and install your app, with metrics for new user counts, device distribution, geographic insights, and typical discovery patterns.
Activation monitors when users experience your app’s core value for the first time, with metrics for activated user counts, session patterns, and first-time user experience optimization.
Retention measures how effectively your app keeps users coming back, with metrics for distinct days used, session frequency, engaged user identification, and long-term usage patterns.
Revenue tracks your app’s financial performance metrics.
Acquisition Analytics
Learn how to interpret and act on acquisition metrics to optimize how users discover your app.
Activation Analytics
Learn how to interpret and act on activation metrics to optimize your app's first-time user experience.
Retention Analytics
Learn how to interpret and act on retention metrics to keep users engaged long-term.
Understanding Pirate Metrics
Learn about the AARRR framework that organizes analytics by acquisition, activation, retention, referral, and revenue.
TelemetryDeck also provides built-in presets for tracking purchases and revenue that require minimal additional configuration in your app:
Purchase Tracking with Built-in Presets
Learn how to track in-app purchases with TelemetryDeck's built-in purchase tracking system and dashboards.
Metrics (Technical Analytics)
The Metrics section provides essential technical insights about your app across different devices and platforms:
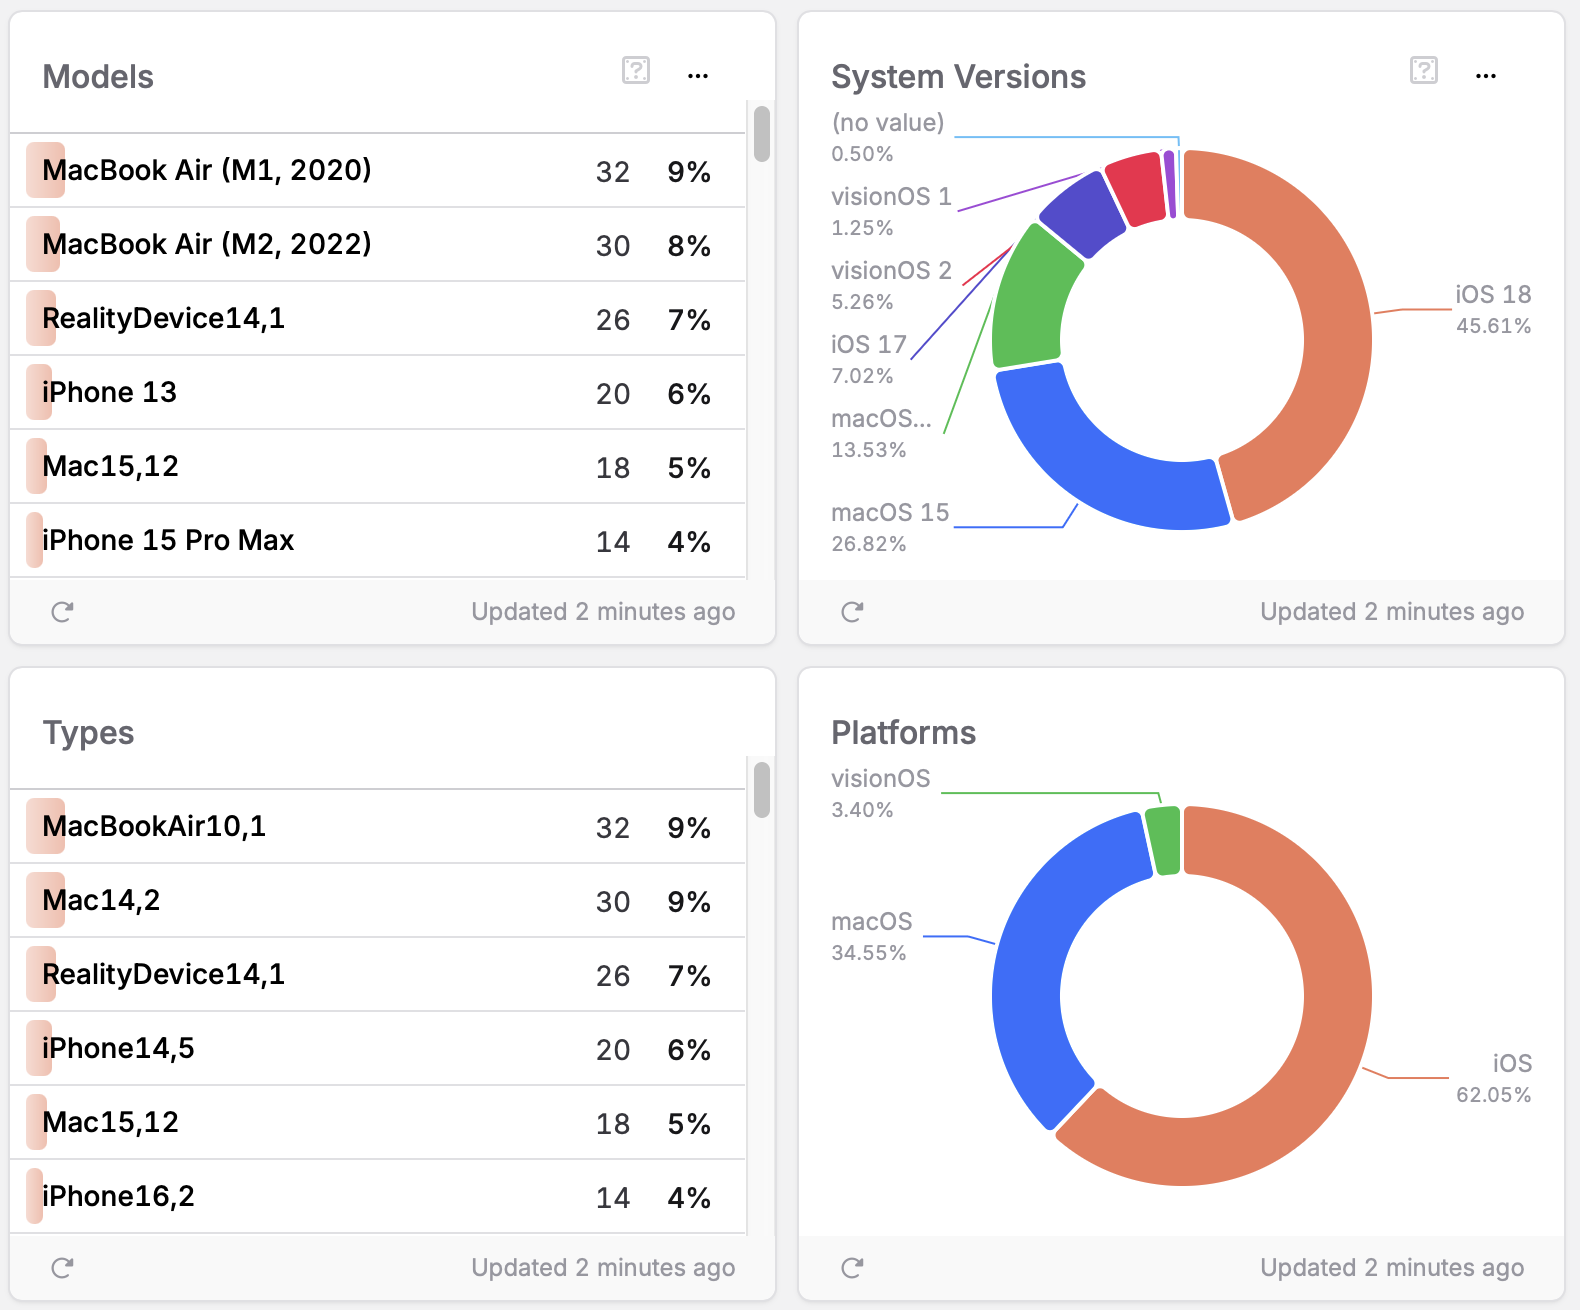
Key metrics include:
- Devices: Hardware models, screen resolutions, and platform distributions
- Versions: App and SDK version adoption rates
- Errors: Issue monitoring by frequency and type
- Localization: Language and regional settings insights
- Accessibility: Usage of accessibility features
Complete Metrics Analytics Guide
Explore our comprehensive guide to technical analytics, including detailed information on device types, app versions, error tracking, localization insights, and accessibility usage.
Explore (Signal Analytics)
The Explore section gives you direct access to your raw event data through multiple views:
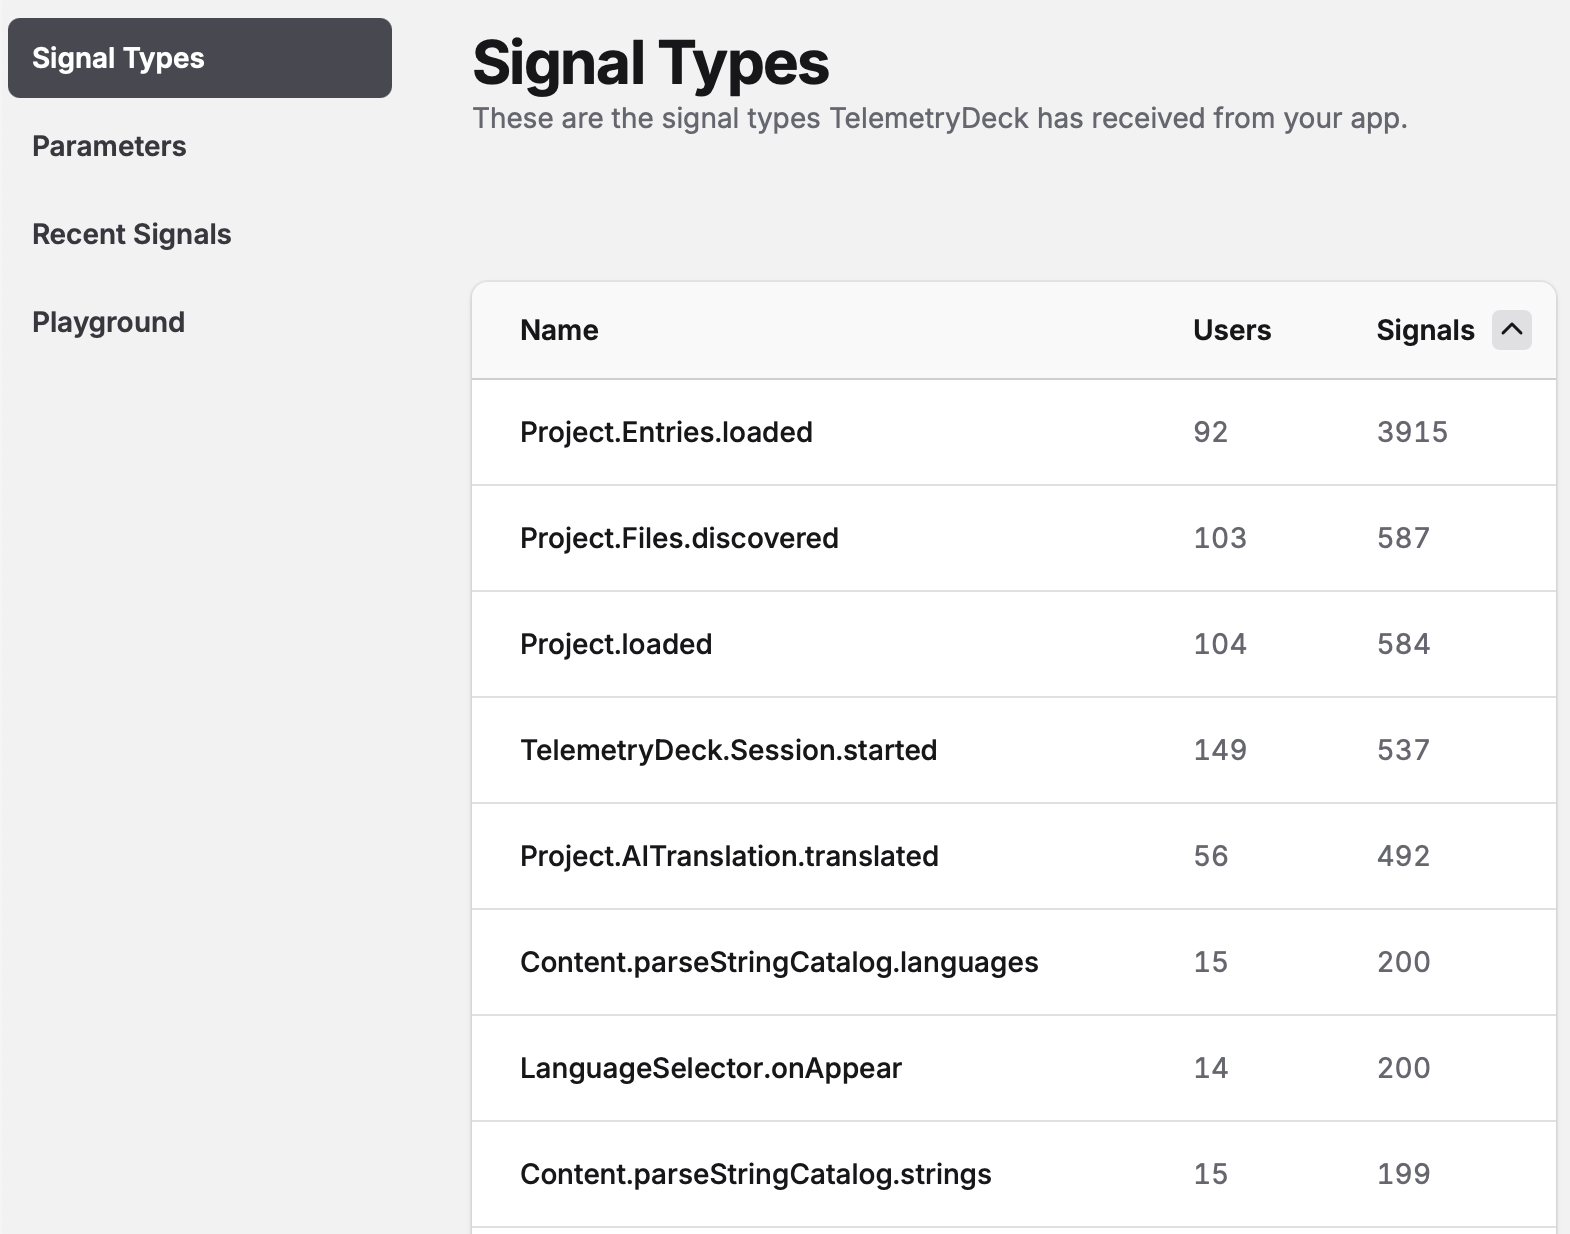
Here you can examine all signal types your app has sent, explore parameters attached to your events, view recent events chronologically, and use the query playground to experiment with data analysis. This section is particularly useful for debugging, understanding user behavior sequences, and diving deeper into specific user actions.
Event Naming Best Practices
Learn how to name your signal types effectively for better organization and analysis.
Dashboards (Custom Insights)
The Dashboards section allows you to create and organize custom visualizations:
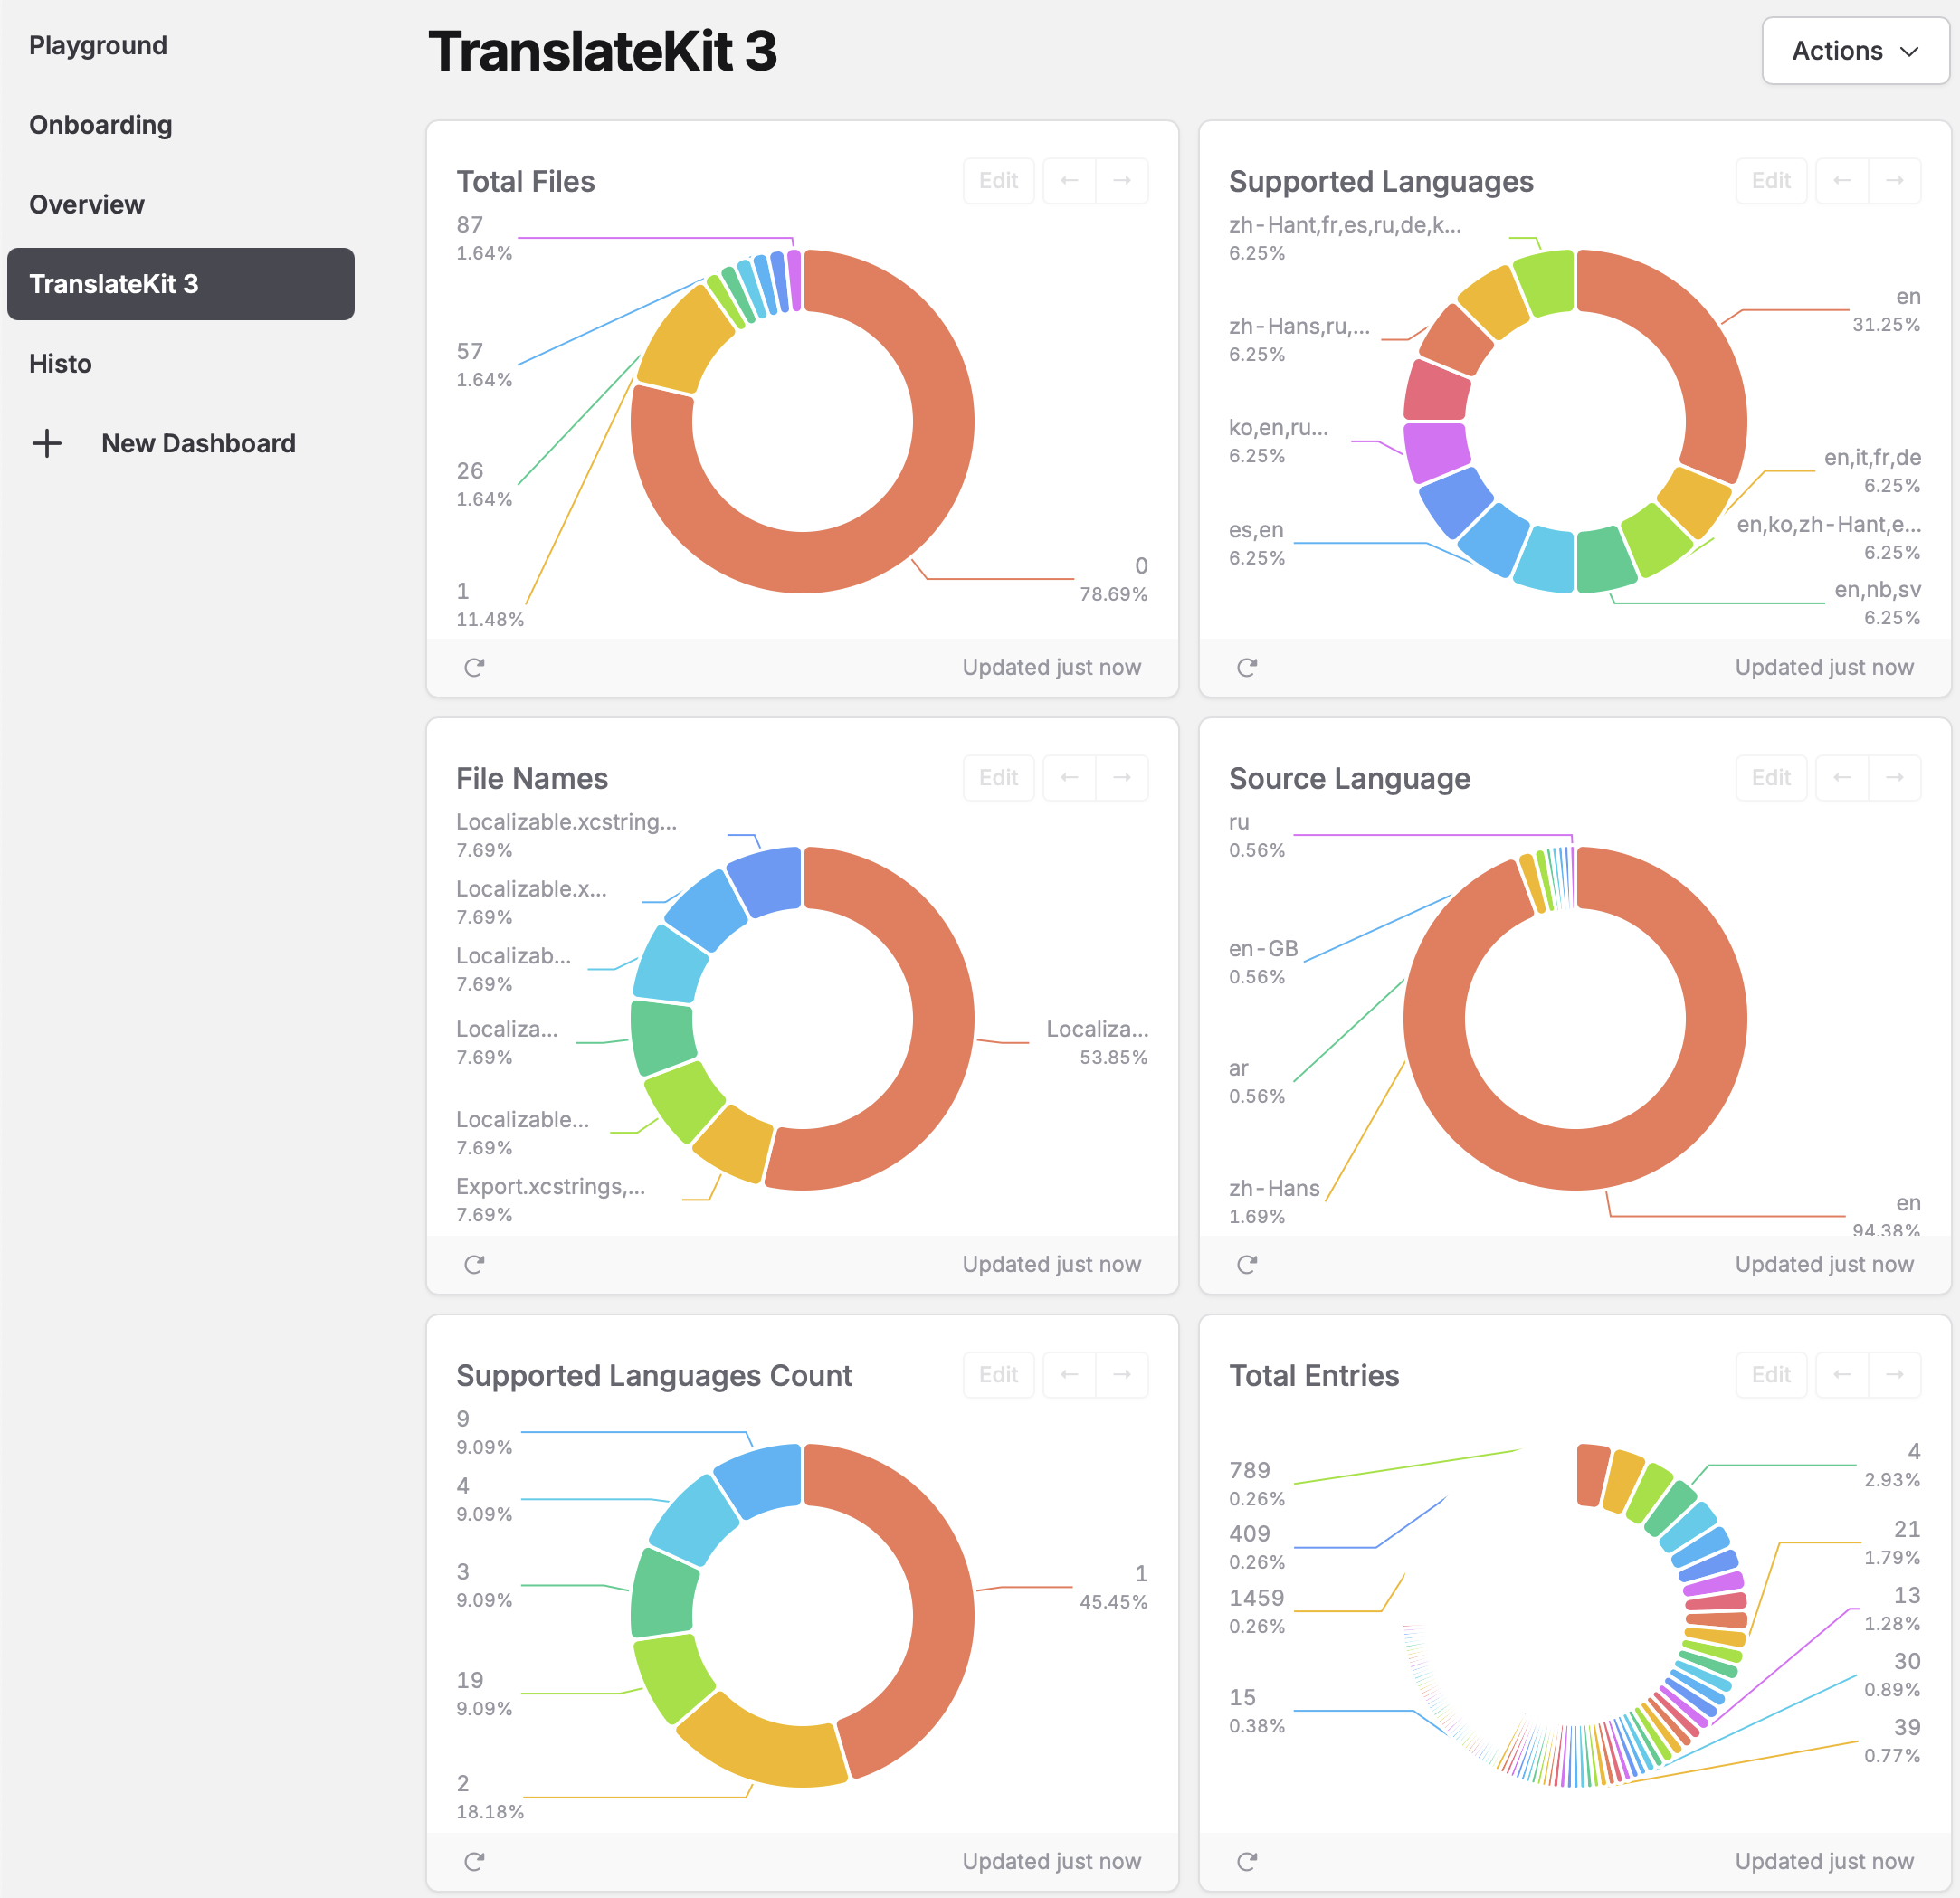
You can build insights using either the visual editor (for simple queries) or TelemetryDeck Query Language (TQL) for more complex analysis. Common dashboard setups include:
- Feature usage dashboards that track adoption of specific features
- Conversion funnels showing how users progress through multi-step processes
- User segment comparisons between different types of users
- Error monitoring dashboards focused on app stability
Each insight can be organized into groups (displayed in the sidebar) to keep related metrics together, such as “Onboarding Experience”, “Premium Features”, or “App Performance”.
Understanding Insights
Learn what insights are and how they help you understand your app's performance data.
Creating Custom Dashboards
Learn how to organize your insights into custom dashboard groups for better organization.
Setting Up Filters
Learn how to use the filter editor to refine your insights and focus on specific data.
Creating Funnel Charts
Learn how to track user conversion through multi-step processes with funnel charts.
Notebooks (Analysis Documentation)
The Notebooks tab lets you combine live charts and markdown text in a single place, so you can document your questions, structure your investigations, and share insights with your team. Perfect for keeping context during long-running analyses, preparing presentations, or leaving notes for your future self.
For example, here’s an excerpt of a notebook: 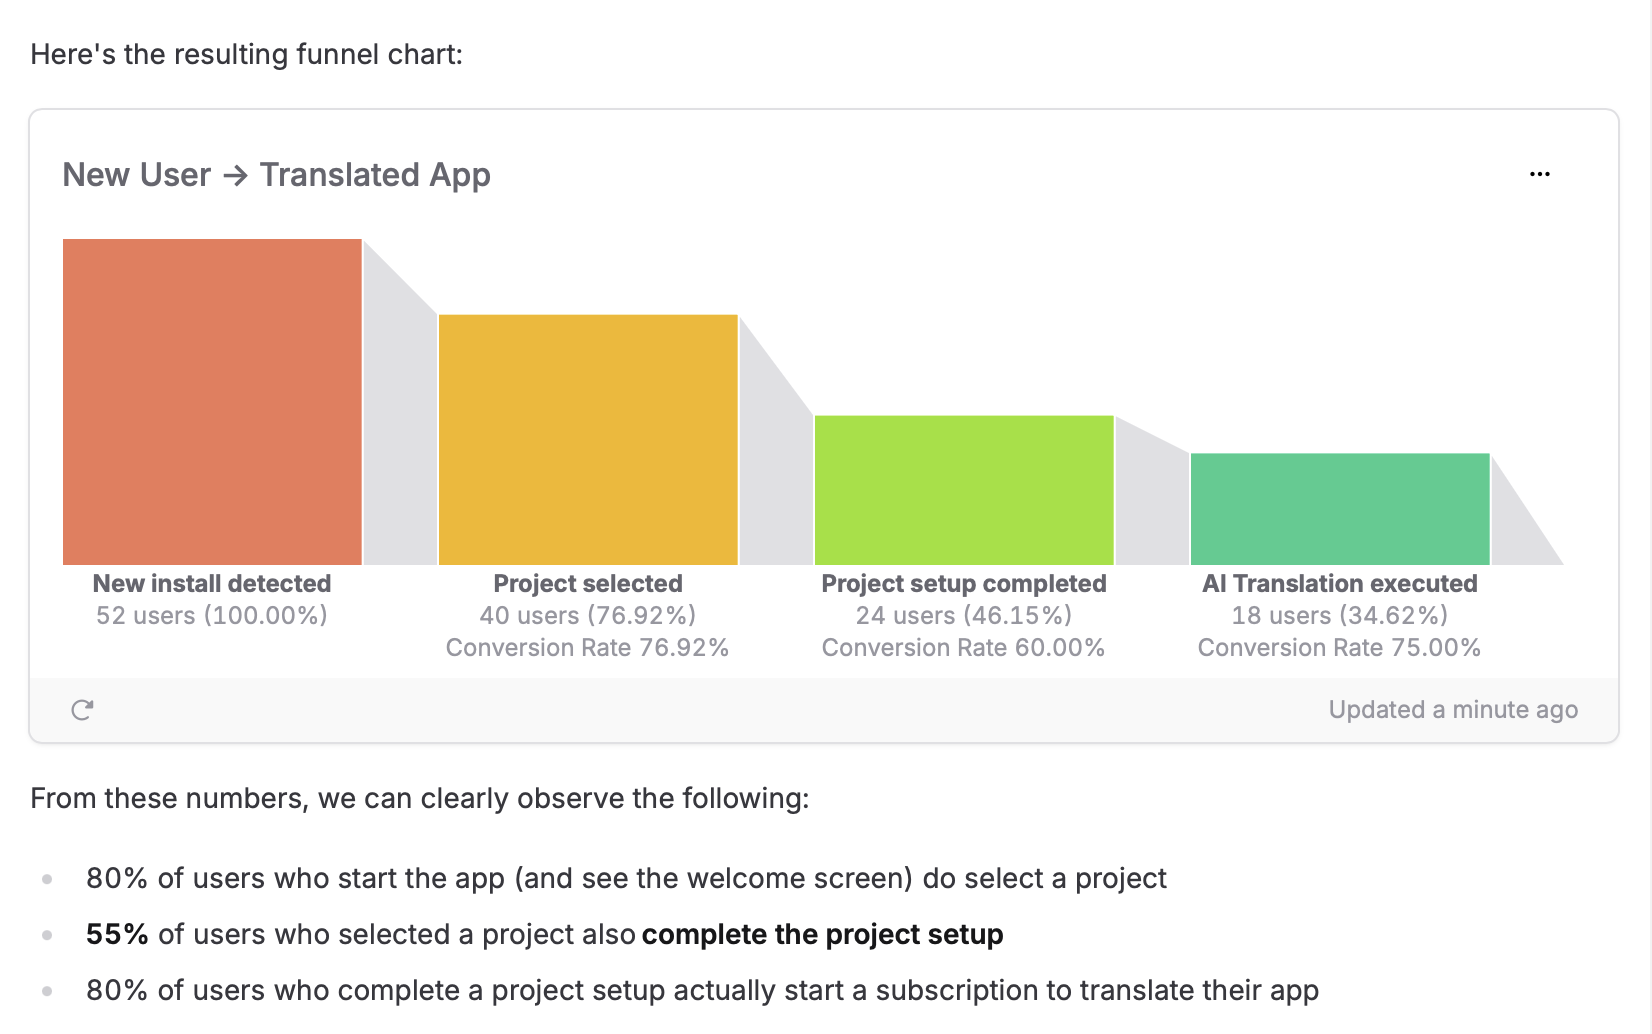
You can use Notebooks to:
- Document your hypotheses and findings alongside live data
- Track what data you’re waiting for and plan next steps
- Share structured analyses with your team or stakeholders
See Notebooks in action in our feature demo video on our YouTube channel!
A Practical Guide to Notebooks
Learn how to effectively use Notebooks to combine live charts and markdown text for better analytics insights and documentation.
Common Dashboard tasks
Filtering data
At the top of most dashboard pages, you’ll find time filters that let you focus on specific periods:
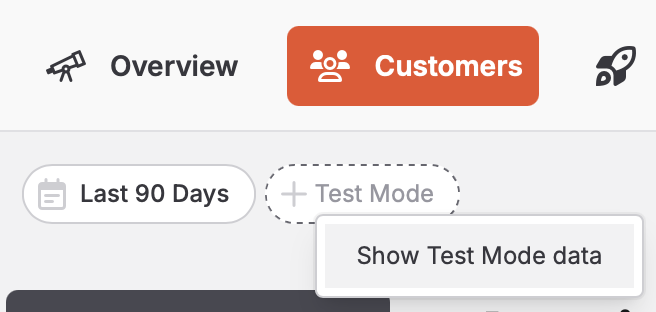
- Last 30 Days (default) – Shows data from the past month
- Test Mode – Toggle to see data from development builds (when your app is run directly from your IDE)
Using Test Mode
Understand how to use Test Mode to separate development events from production data.
Exploring details
Many visualizations have interactive elements:
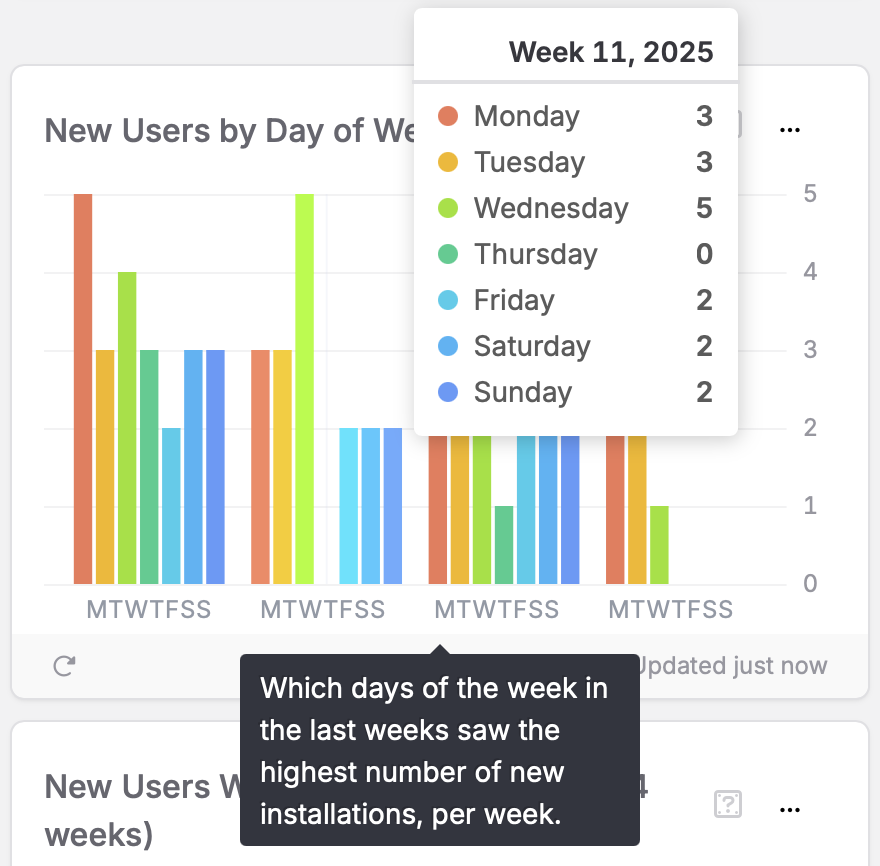
- Hover over chart elements to see detailed values and source info
- Use the “…” menu in the top right of cards for additional options
Collaboration
Inviting Team Members
Learn how to invite colleagues to your TelemetryDeck organization and collaborate on analytics.
Advanced features
Using TQL for Advanced Queries
Learn about TelemetryDeck Query Language for creating complex custom insights.
Website Traffic Source Analysis
For web apps, learn how to track where your users are coming from before visiting your site.
Integrations
RevenueCat Integration
Learn how to integrate TelemetryDeck with RevenueCat to combine usage data with purchase data.
Superwall Integration
Learn how to integrate TelemetryDeck with Superwall to get insights into your paywalls.
Privacy & Security
How User Data Anonymization Works
Learn how TelemetryDeck protects user privacy while still providing valuable analytics.
Privacy FAQ
Find answers to common questions about TelemetryDeck's privacy features and policies.
