
#docs #basics #setup #basics #pirate-metrics #retention
Retention Analytics
Retention is the third stage of the Pirate Metrics framework, focusing on how effectively your app keeps users coming back over time. TelemetryDeck automatically tracks these patterns to help you optimize long-term user engagement and identify your most valuable users.
What is User Retention?
User retention measures how effectively your app keeps users coming back after their initial experience. These metrics help you understand user loyalty, reduce churn rate, identify engagement patterns, and spot opportunities to strengthen long-term relationships with your user base – ultimately increasing customer lifetime value (LTV).
With TelemetryDeck’s Retention dashboard, these insights focus on users who can be considered “returning users” (those with more than 5 sessions) and are automatically collected with no additional code required beyond updating to SwiftSDK 2.8.0 / KotlinSDK 6.0.0 or later.
Returning user growth trends
Questions you can answer:
- How many of my users are becoming regular, returning users?
- Are my retention rates improving over time?
- What are the immediate retention patterns in the last 24 hours?
- How do retention trends compare across different time periods?
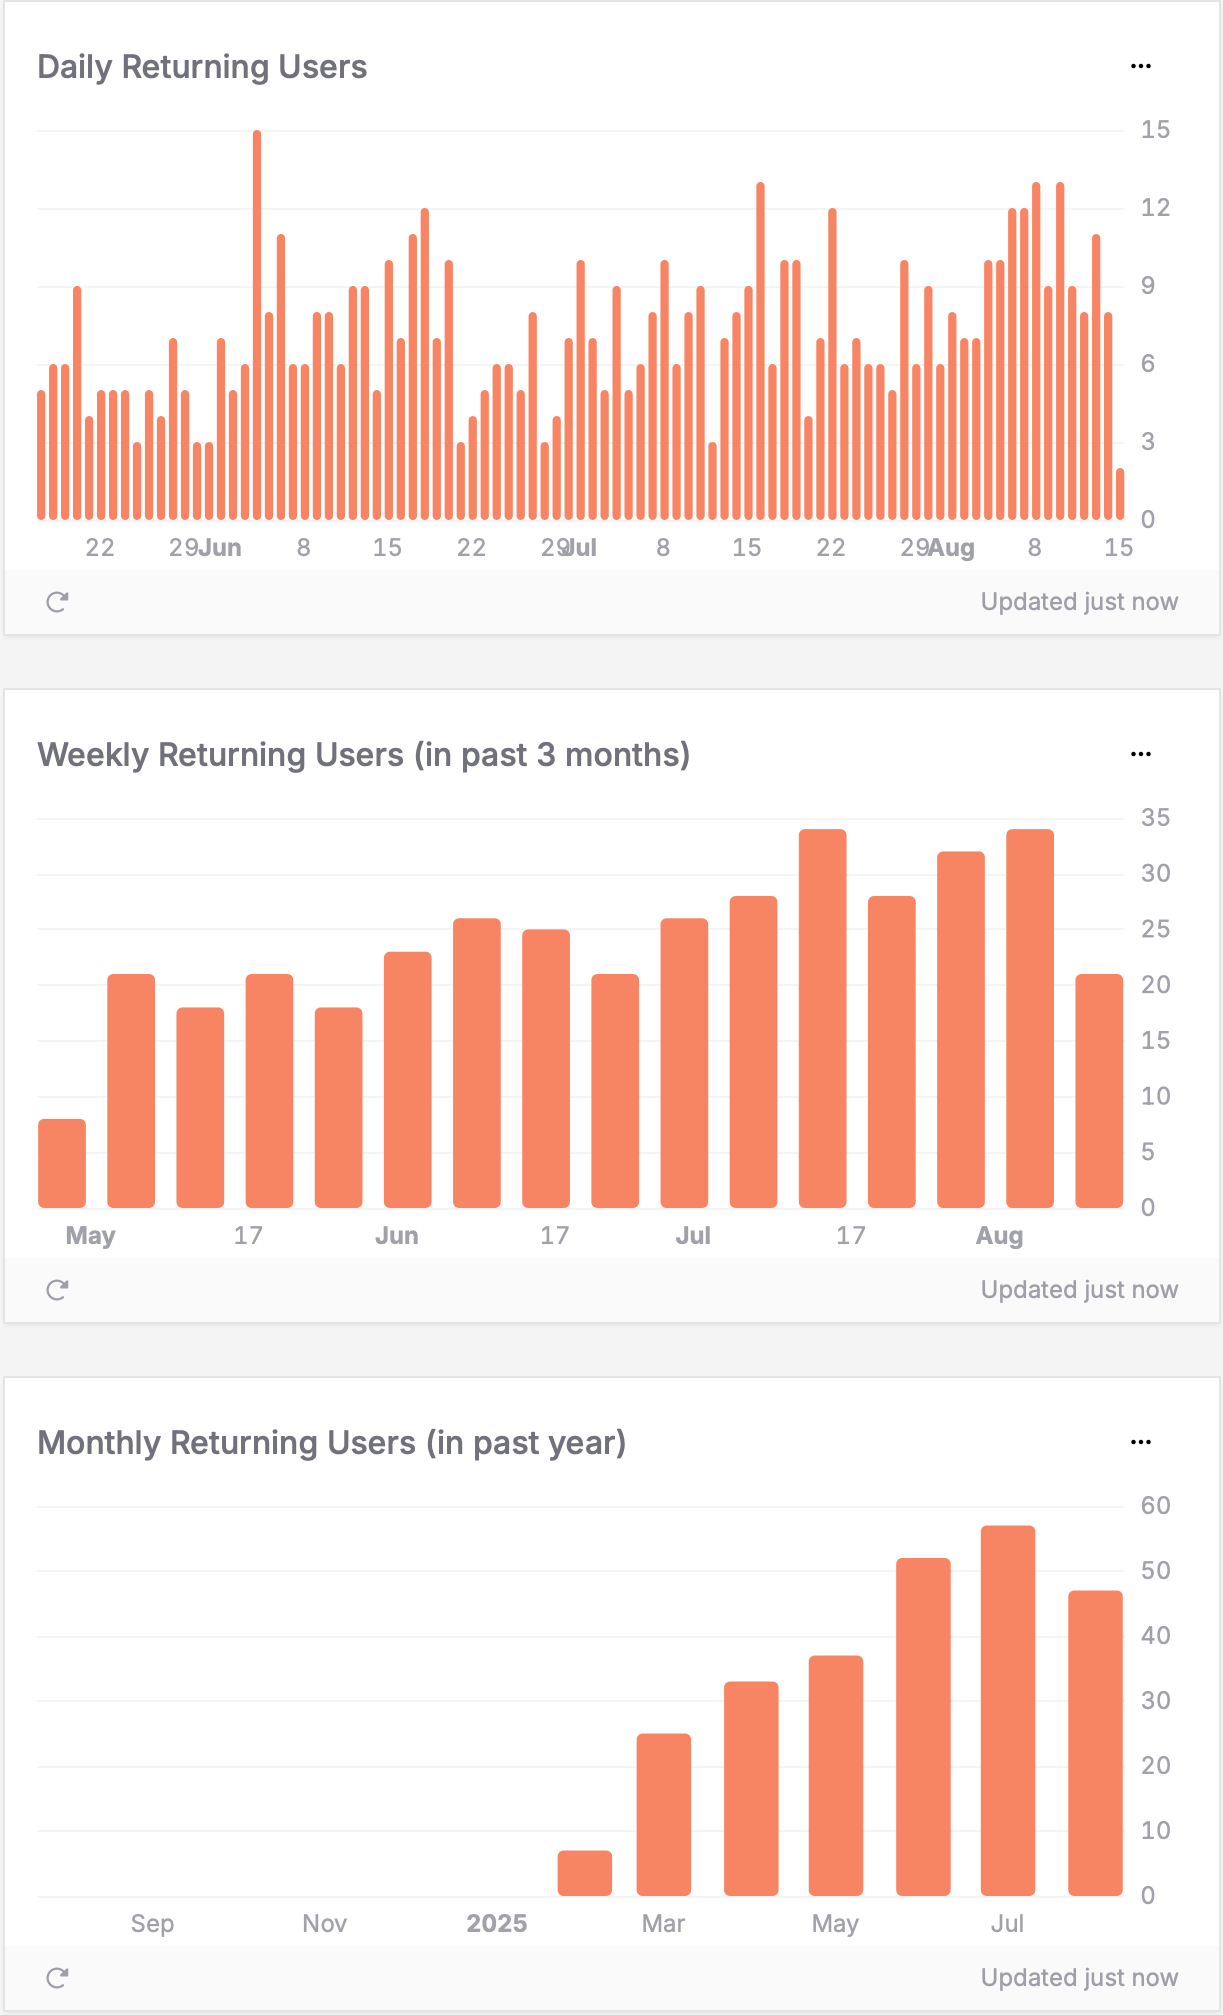
How to interpret the charts:
- Hourly (last 24h): Shows recent returning user activity – useful for immediate validation of retention initiatives
- Daily patterns: Consistent levels indicate stable user engagement; growth suggests improving retention strategies
- Weekly/Monthly trends: Reveal long-term retention health and seasonal engagement patterns
- Declining trends: May indicate rising churn rate due to user experience issues, feature problems, or competitive pressures
How to read your data: In this example dashboard, the monthly chart shows excellent retention growth from March (~8 users) building steadily through the months to reach a strong July peak (~57 users), indicating highly successful retention strategies building momentum over time. The weekly view shows more gradual growth from ~8 to ~35 users over the past 3 months, while daily retention fluctuates between 3-15 users with occasional spikes. Use the daily fluctuations to validate immediate retention initiatives rather than waiting for weekly trends to develop.
Retention time patterns
Questions you can answer:
- When do returning users typically engage with my app during the day?
- Which days of the week show the strongest user loyalty?
- Do returning users prefer weekdays or weekends for app usage?
- Are retention patterns changing over recent weeks?
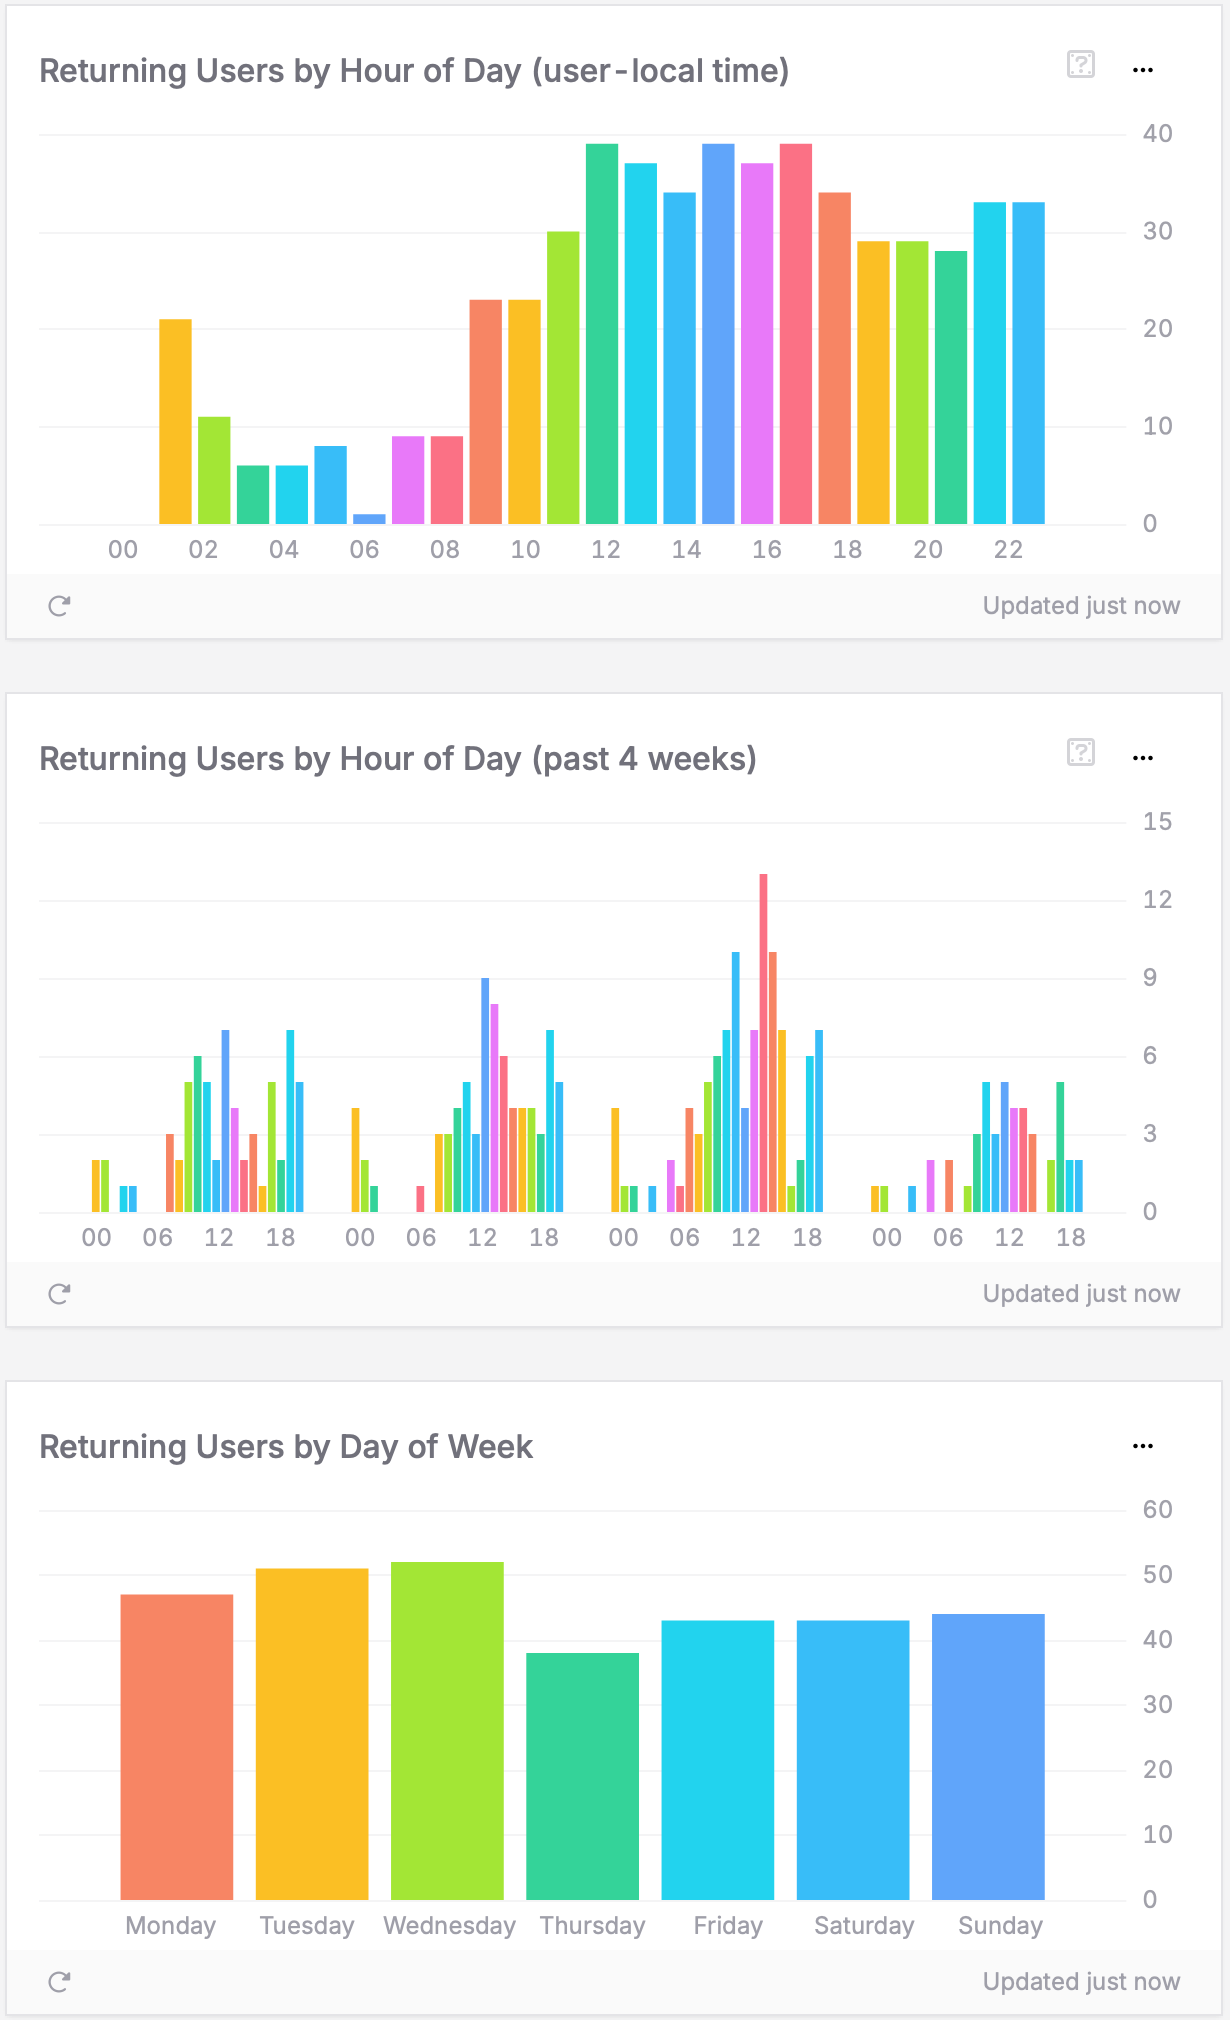
How to interpret the charts:
- Hour of day patterns: Show when returning users are most active (user-local timezone)
- Day of week distribution: Reveals which days drive the strongest retention engagement
- Day patterns (past 4 weeks): Identify specific days with exceptional returning user activity
- Weekend vs. weekday balance: Indicates whether your app fits into work routines or leisure time
How to read your data: In this example, the Hour of Day chart shows returning users are most active during midday hours (12-3 PM) with peak activity around 2 PM, suggesting users engage with the app during lunch breaks and afternoon periods. The Day of Week chart reveals Wednesday shows the strongest retention (~55 users), followed by Tuesday (~53) and Monday (~50), while Thursday shows the lowest (~40). Friday through Sunday maintain consistent moderate levels (~45 each). When you see patterns like this in your data, it would indicate your app fits well into midweek routines. You could then schedule feature updates and important communications for Wednesday when user engagement peaks.
Retention by device & platform
Questions you can answer:
- Which devices retain users most effectively?
- Are there platform-specific retention challenges?
- Should I prioritize retention improvements for specific hardware?
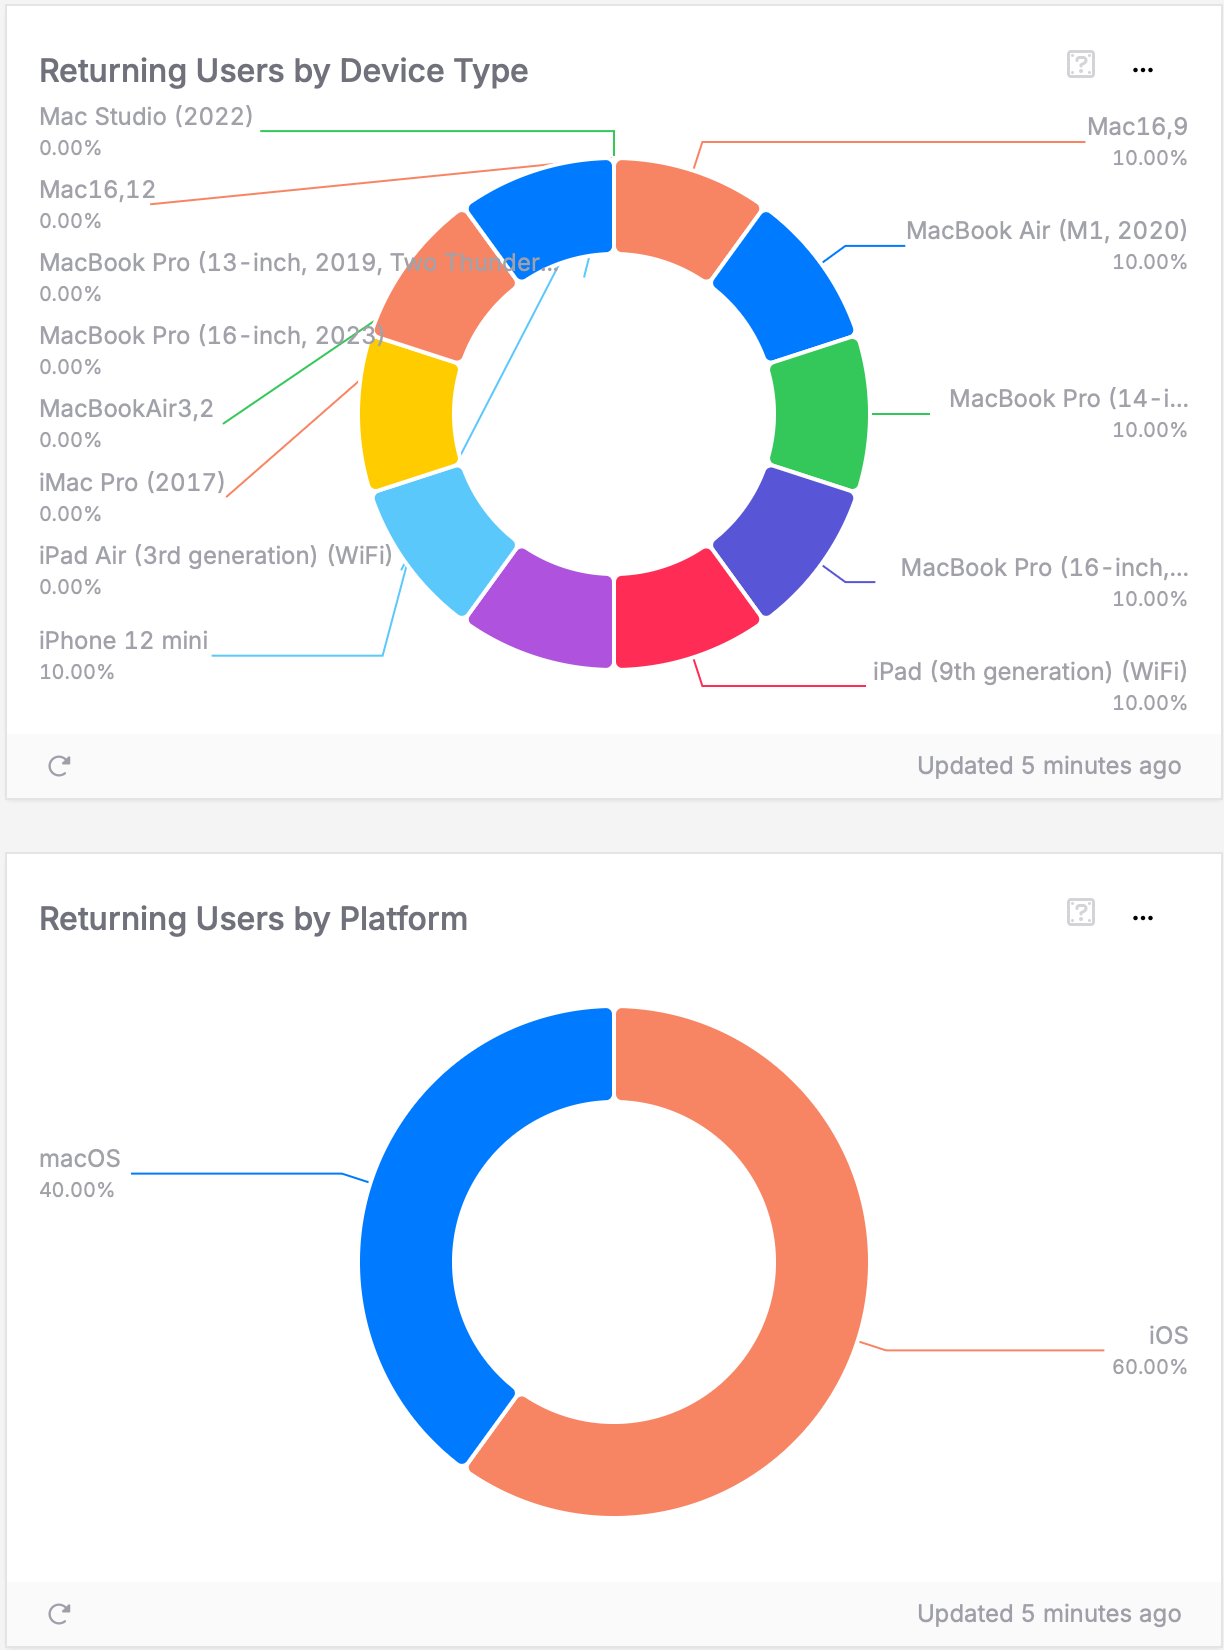
How to interpret the charts:
- Top-retention devices: These provide the best long-term user experience
- Poor retention devices: May have performance issues, UI problems, or technical barriers
- Platform differences: iOS vs. macOS vs. other platforms may show different retention strengths
How to read your data: In this example, iOS represents 60% of returning users while macOS accounts for 40%. Among individual devices, several models each contribute about 10% of returning users (iPhone 12 mini, iPad 9th generation, various MacBook Air and MacBook Pro models). When you see relatively even distribution across device types like this, it suggests your app provides consistent long-term value across different platforms and device generations. The strong macOS presence (40%) would indicate successful cross-platform retention and higher repeat purchase rate (RPR) for users who engage across multiple devices. If you see similar patterns, focus on maintaining this consistency rather than optimizing for specific hardware configurations.
Retention by geography & language
Questions you can answer:
- Which regions show the strongest user loyalty?
- What languages correlate with higher long-term engagement?
- Are there cultural or regional patterns in user retention?
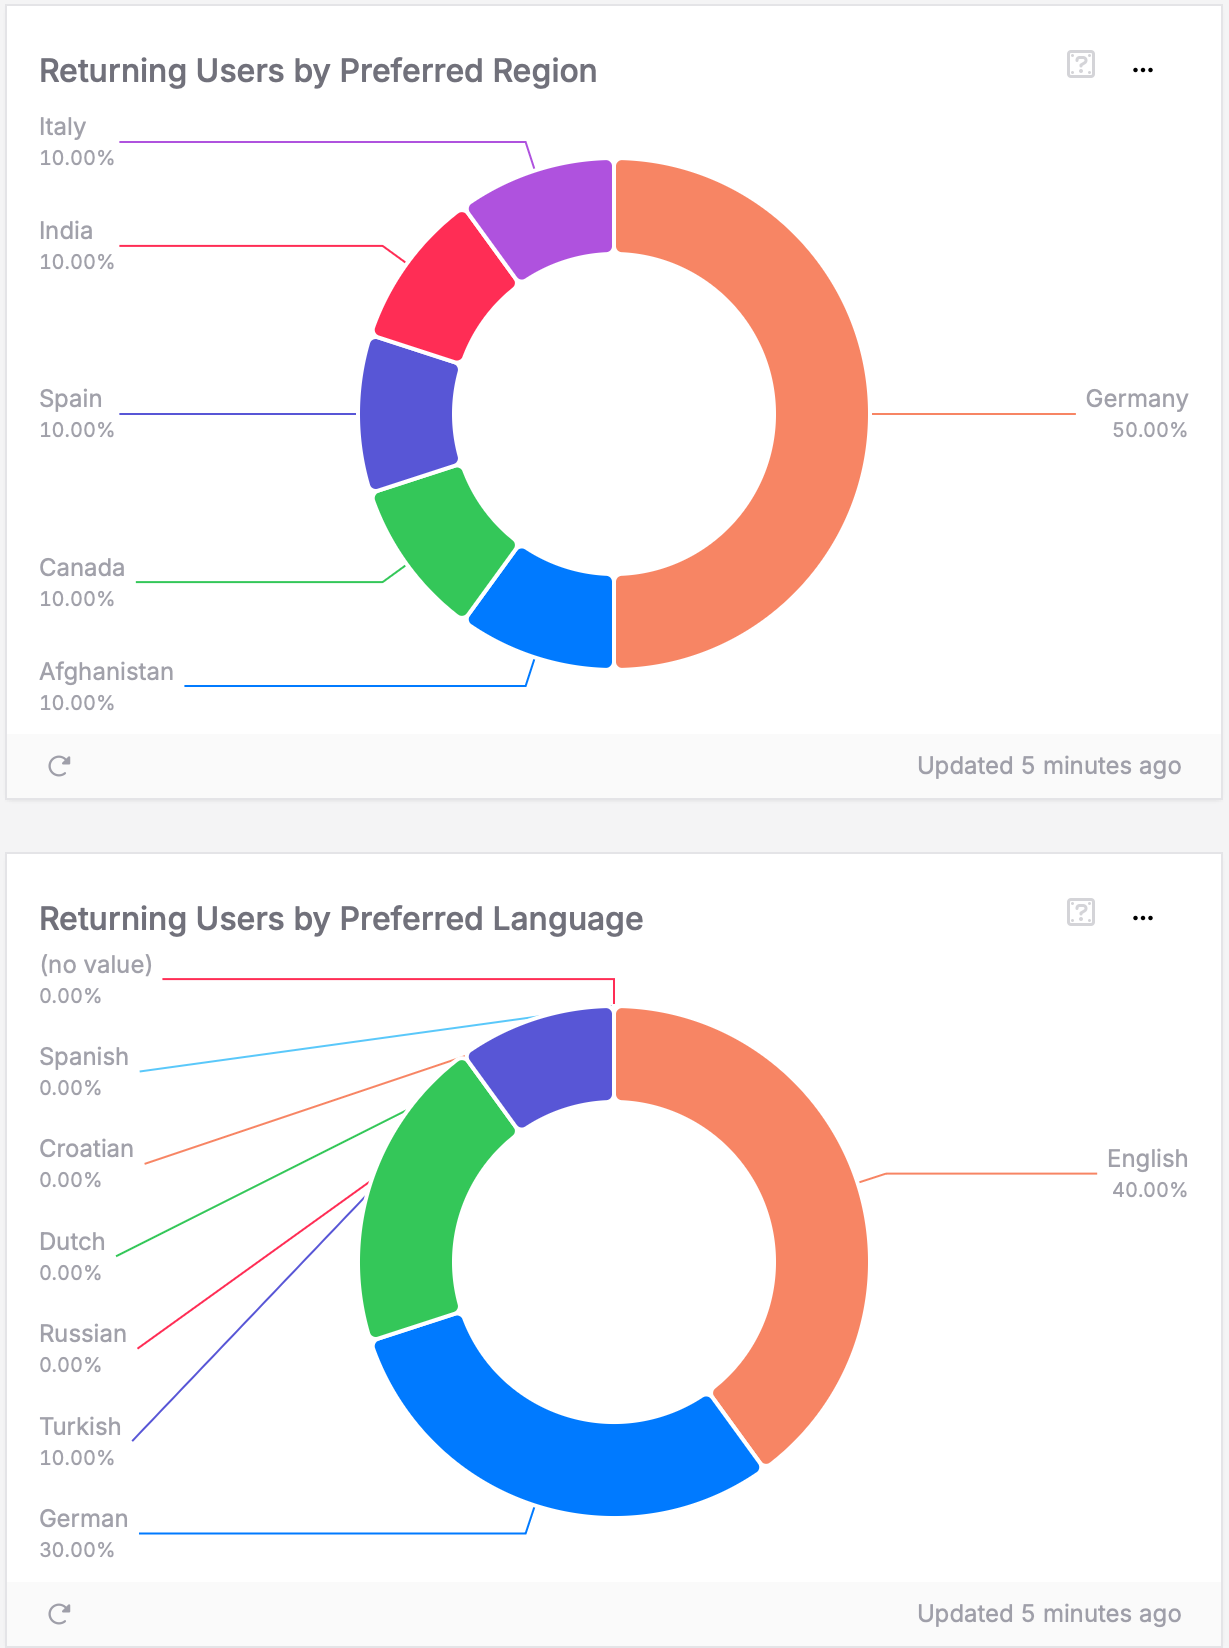
How to interpret the charts:
- High-retention regions: Countries where users consistently return to your app
- Growing markets: Regions showing improving retention that warrant additional investment
- Language loyalty patterns: Languages that correlate with strong long-term engagement
How to read your data: In this example dashboard, Germany dominates at 50% of returning users, with several other countries each representing about 10% (Italy, India, Spain, Canada, Afghanistan). The language distribution shows English (40%) and German (30%) as the primary languages, with Turkish (10%) as a notable third language. When you see such strong geographic concentration in your own data (like Germany’s 50% here), it suggests that users in this region find exceptional long-term value in your app. You could then study what works particularly well for your top-retention market and apply those insights to improve retention in other regions.
Taking action on retention insights
The key to improving retention lies in asking the right questions and forming creative hypotheses about your data patterns. Look beyond the obvious metrics – combine insights across time, geography, and device patterns to uncover unique opportunities for keeping users engaged and maximizing customer lifetime value (LTV). Remember that retention is where sustainable app growth happens: users who return regularly generate the most value, provide the best feedback, and become your strongest advocates for organic growth.