Version 3.0 has Funnels!
Introducing TelemetryDeck's New Funnels Feature
The latest, coolest version of TelemetryDeck is now available, and it includes a feature that many people have been asking – nay, clamoring! – for. The new funnels feature provides a visual way for users to create funnels that analyze users' journey through the app. This latest update also includes better charts and an updated layout for the insight editor.
Funnels
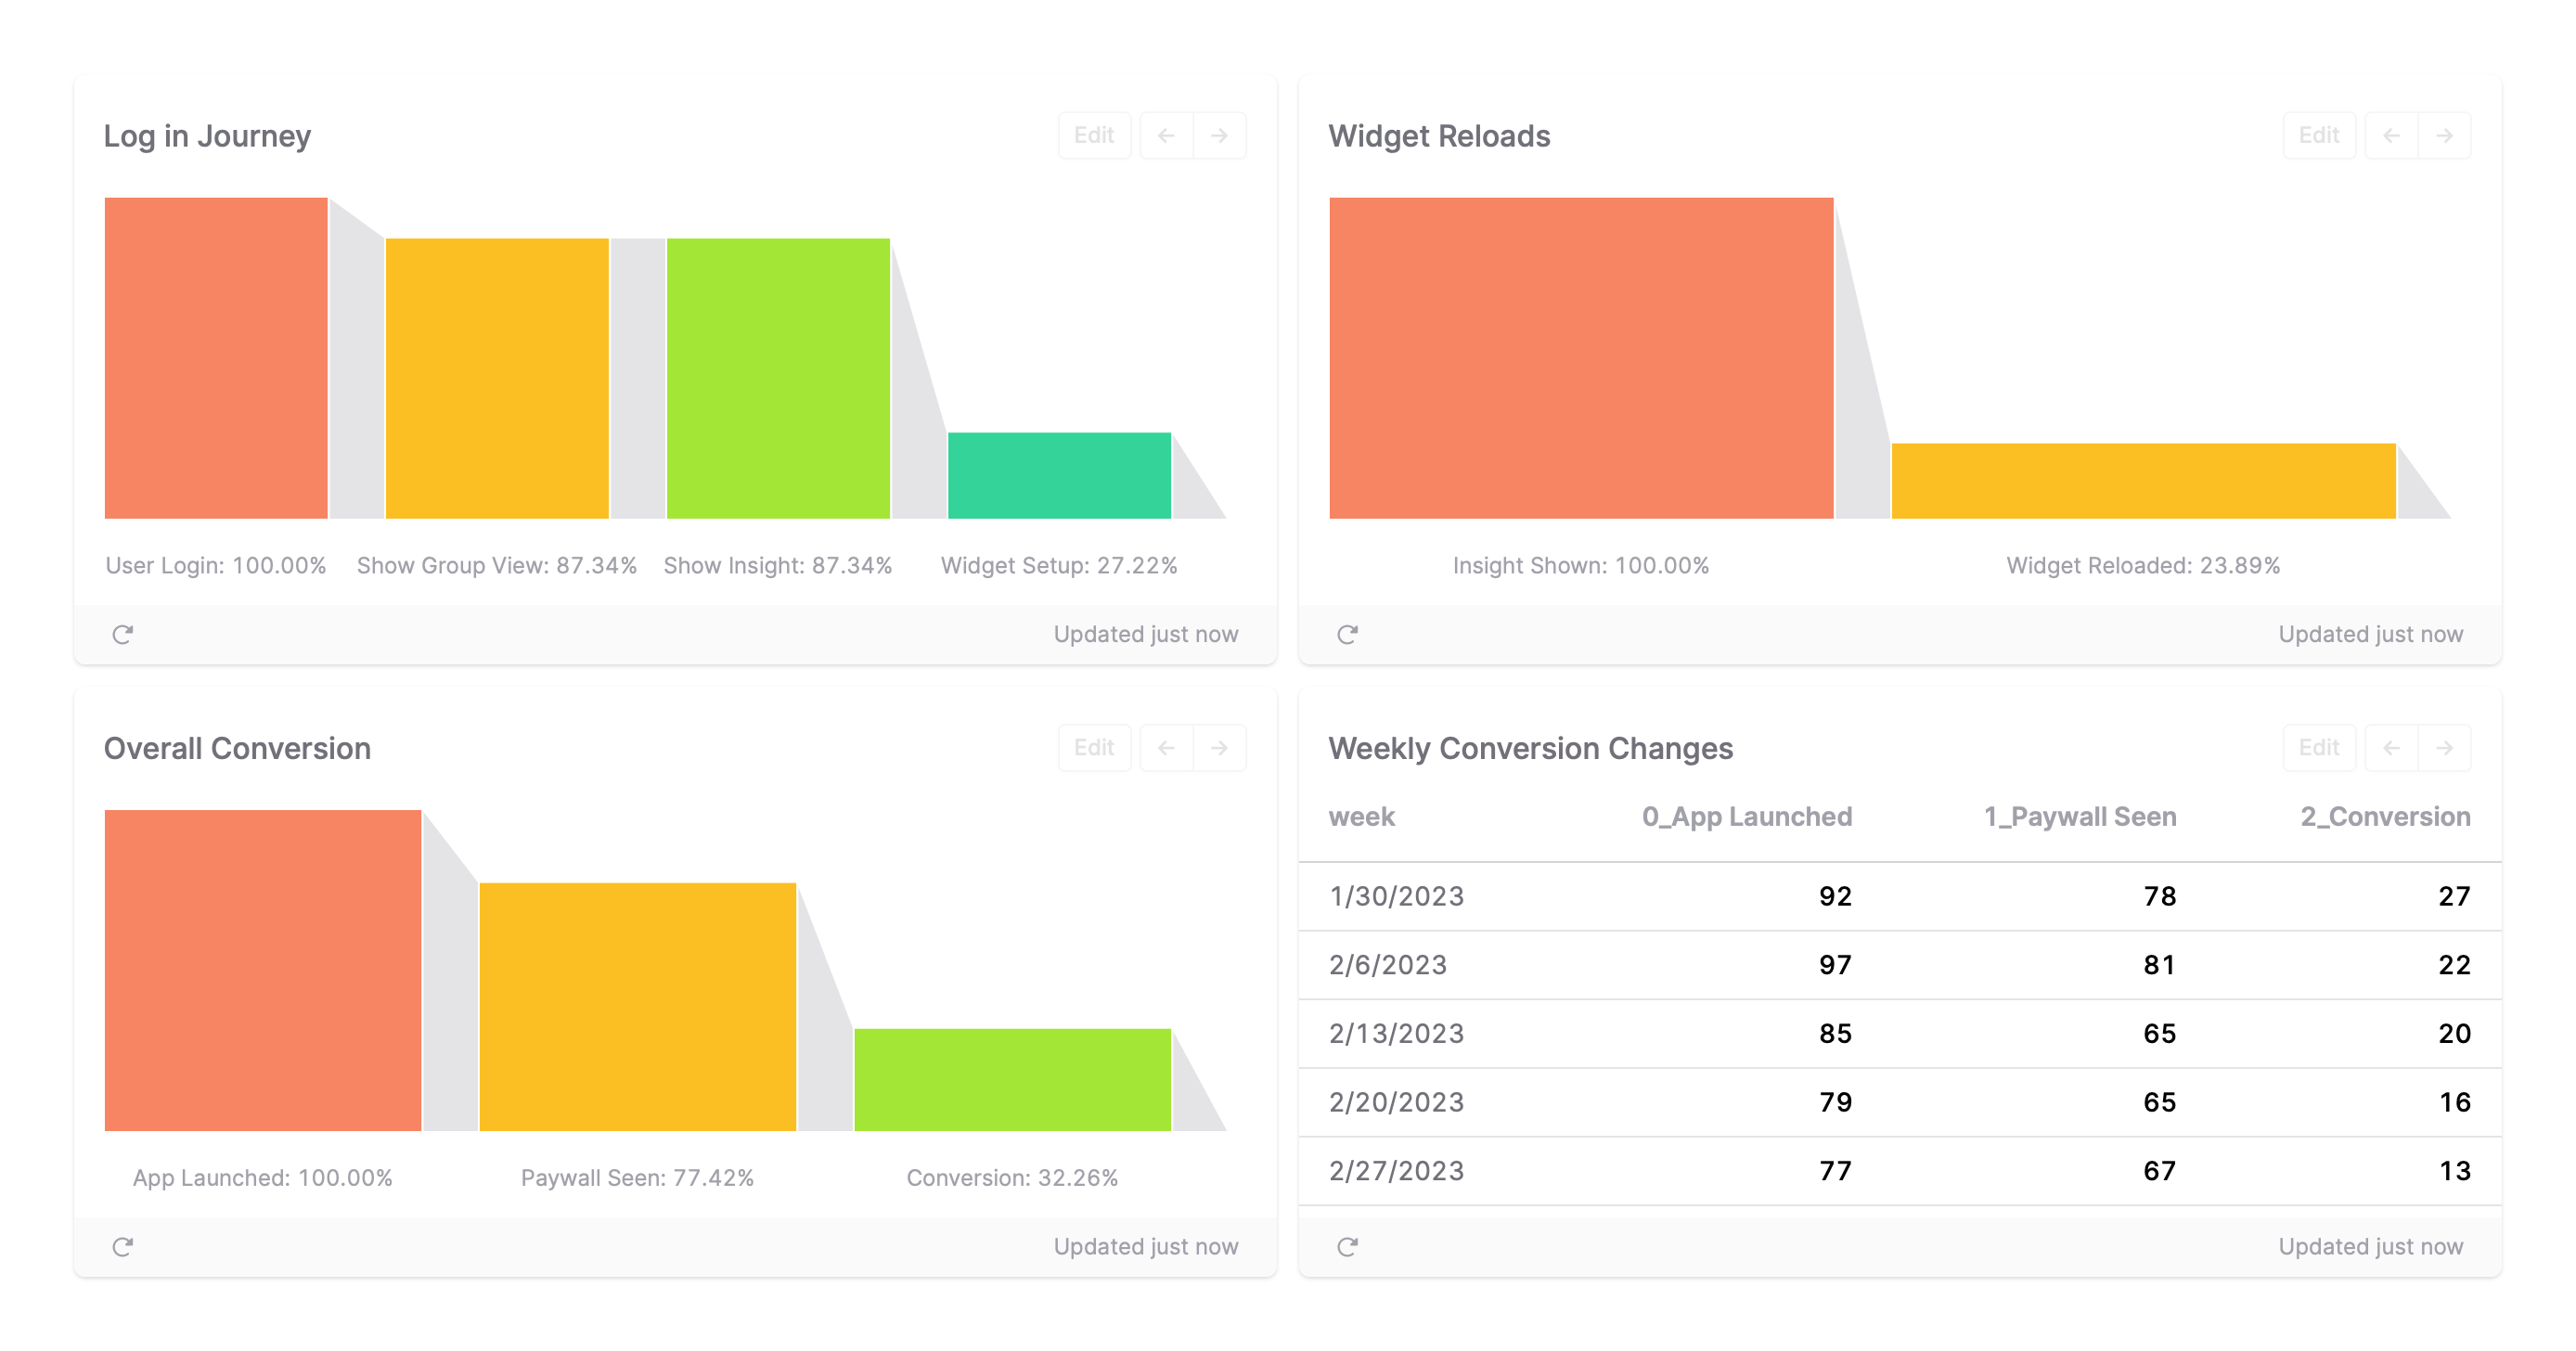
The funnels feature is a valuable tool for app owners and marketing teams. Building on last month’s filter editor, it allows you to track the conversion of users through a series of events in your app.
You can create a funnel by setting the insight query type to Funnel Query, and then providing a filter statement for each specific event or step that you want to track. TelemetryDeck will display the conversion rates between each stage of the funnel.
The visual representation of the funnel makes it easy to see where users are dropping off and which stages may need improvement.
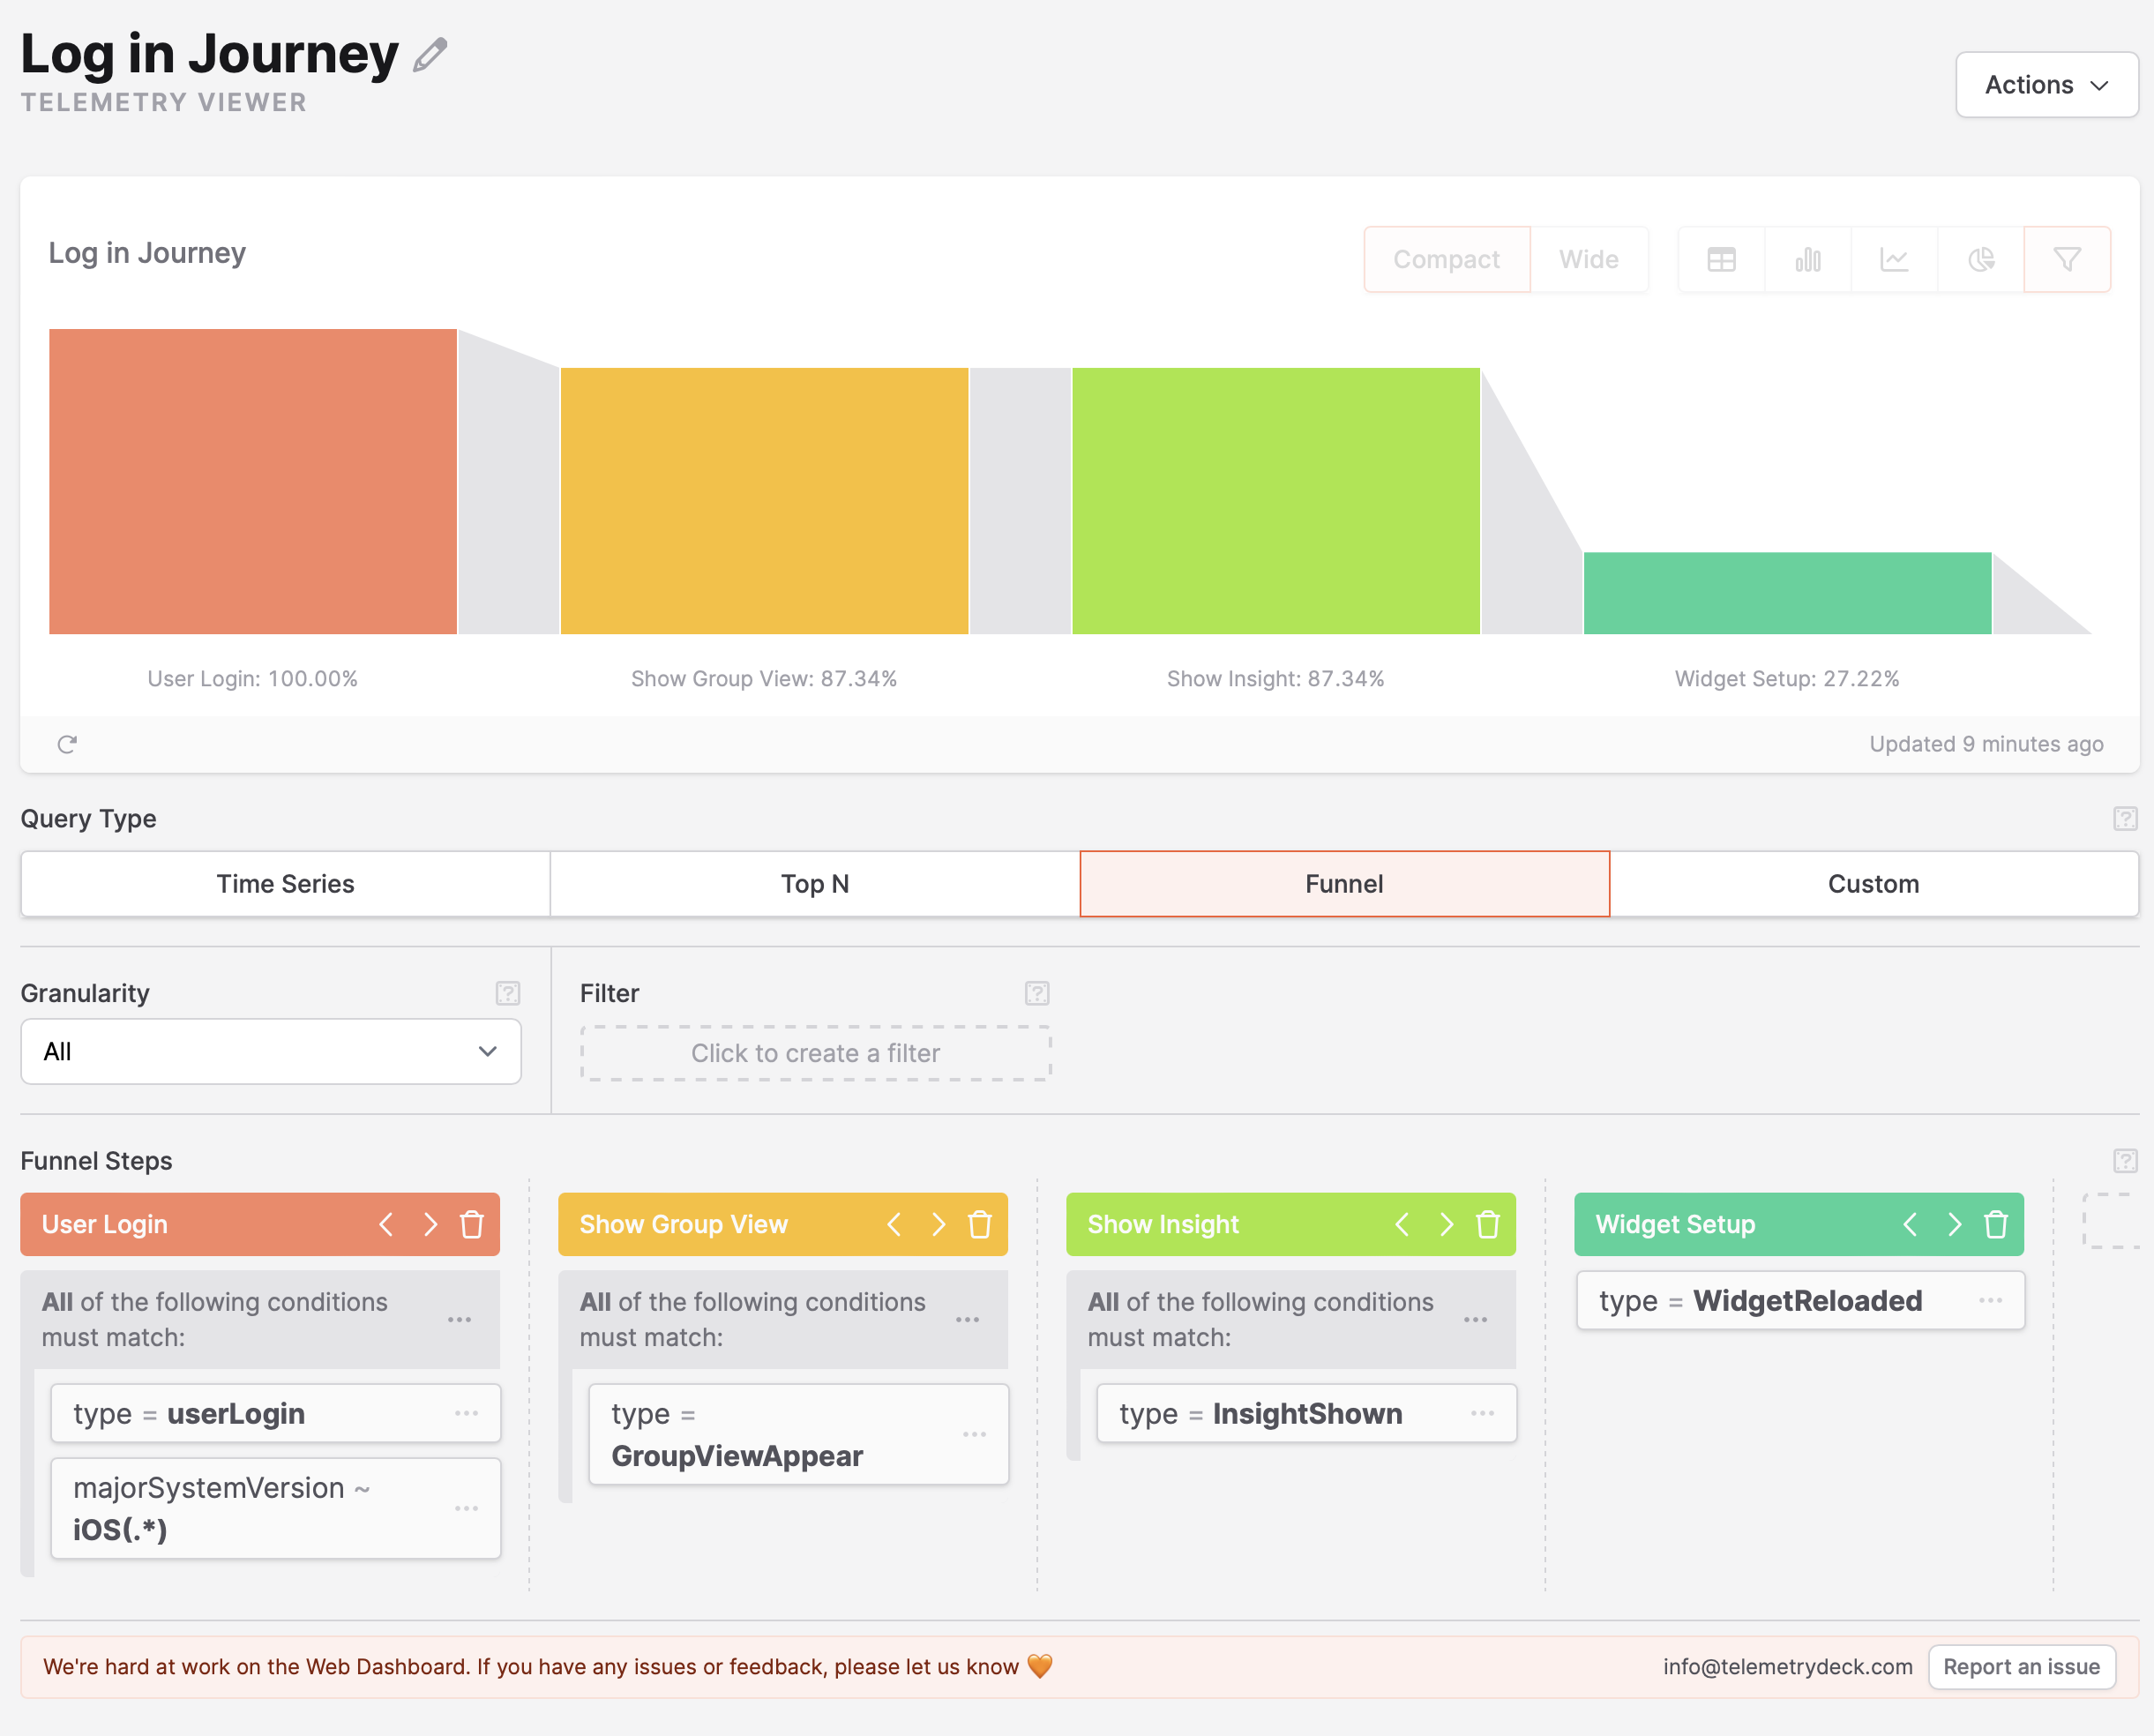
You can create and edit funnel charts in the Insight Editor by setting the Query Type to Funnel and the chart type to Funnel Chart. Then use the new Funnel Steps editor to create filters that represent the conditions for each step to be met.
Funnels always count unique users, not events or signals, and funnel steps are intersections with all previous steps. That means that for e.g. step 3 of a funnel, only users are counted that have met steps 1, 2 and 3. You don’t need to repeat filter conditions.
Read more about funnels in our docs!
New and improved Charts
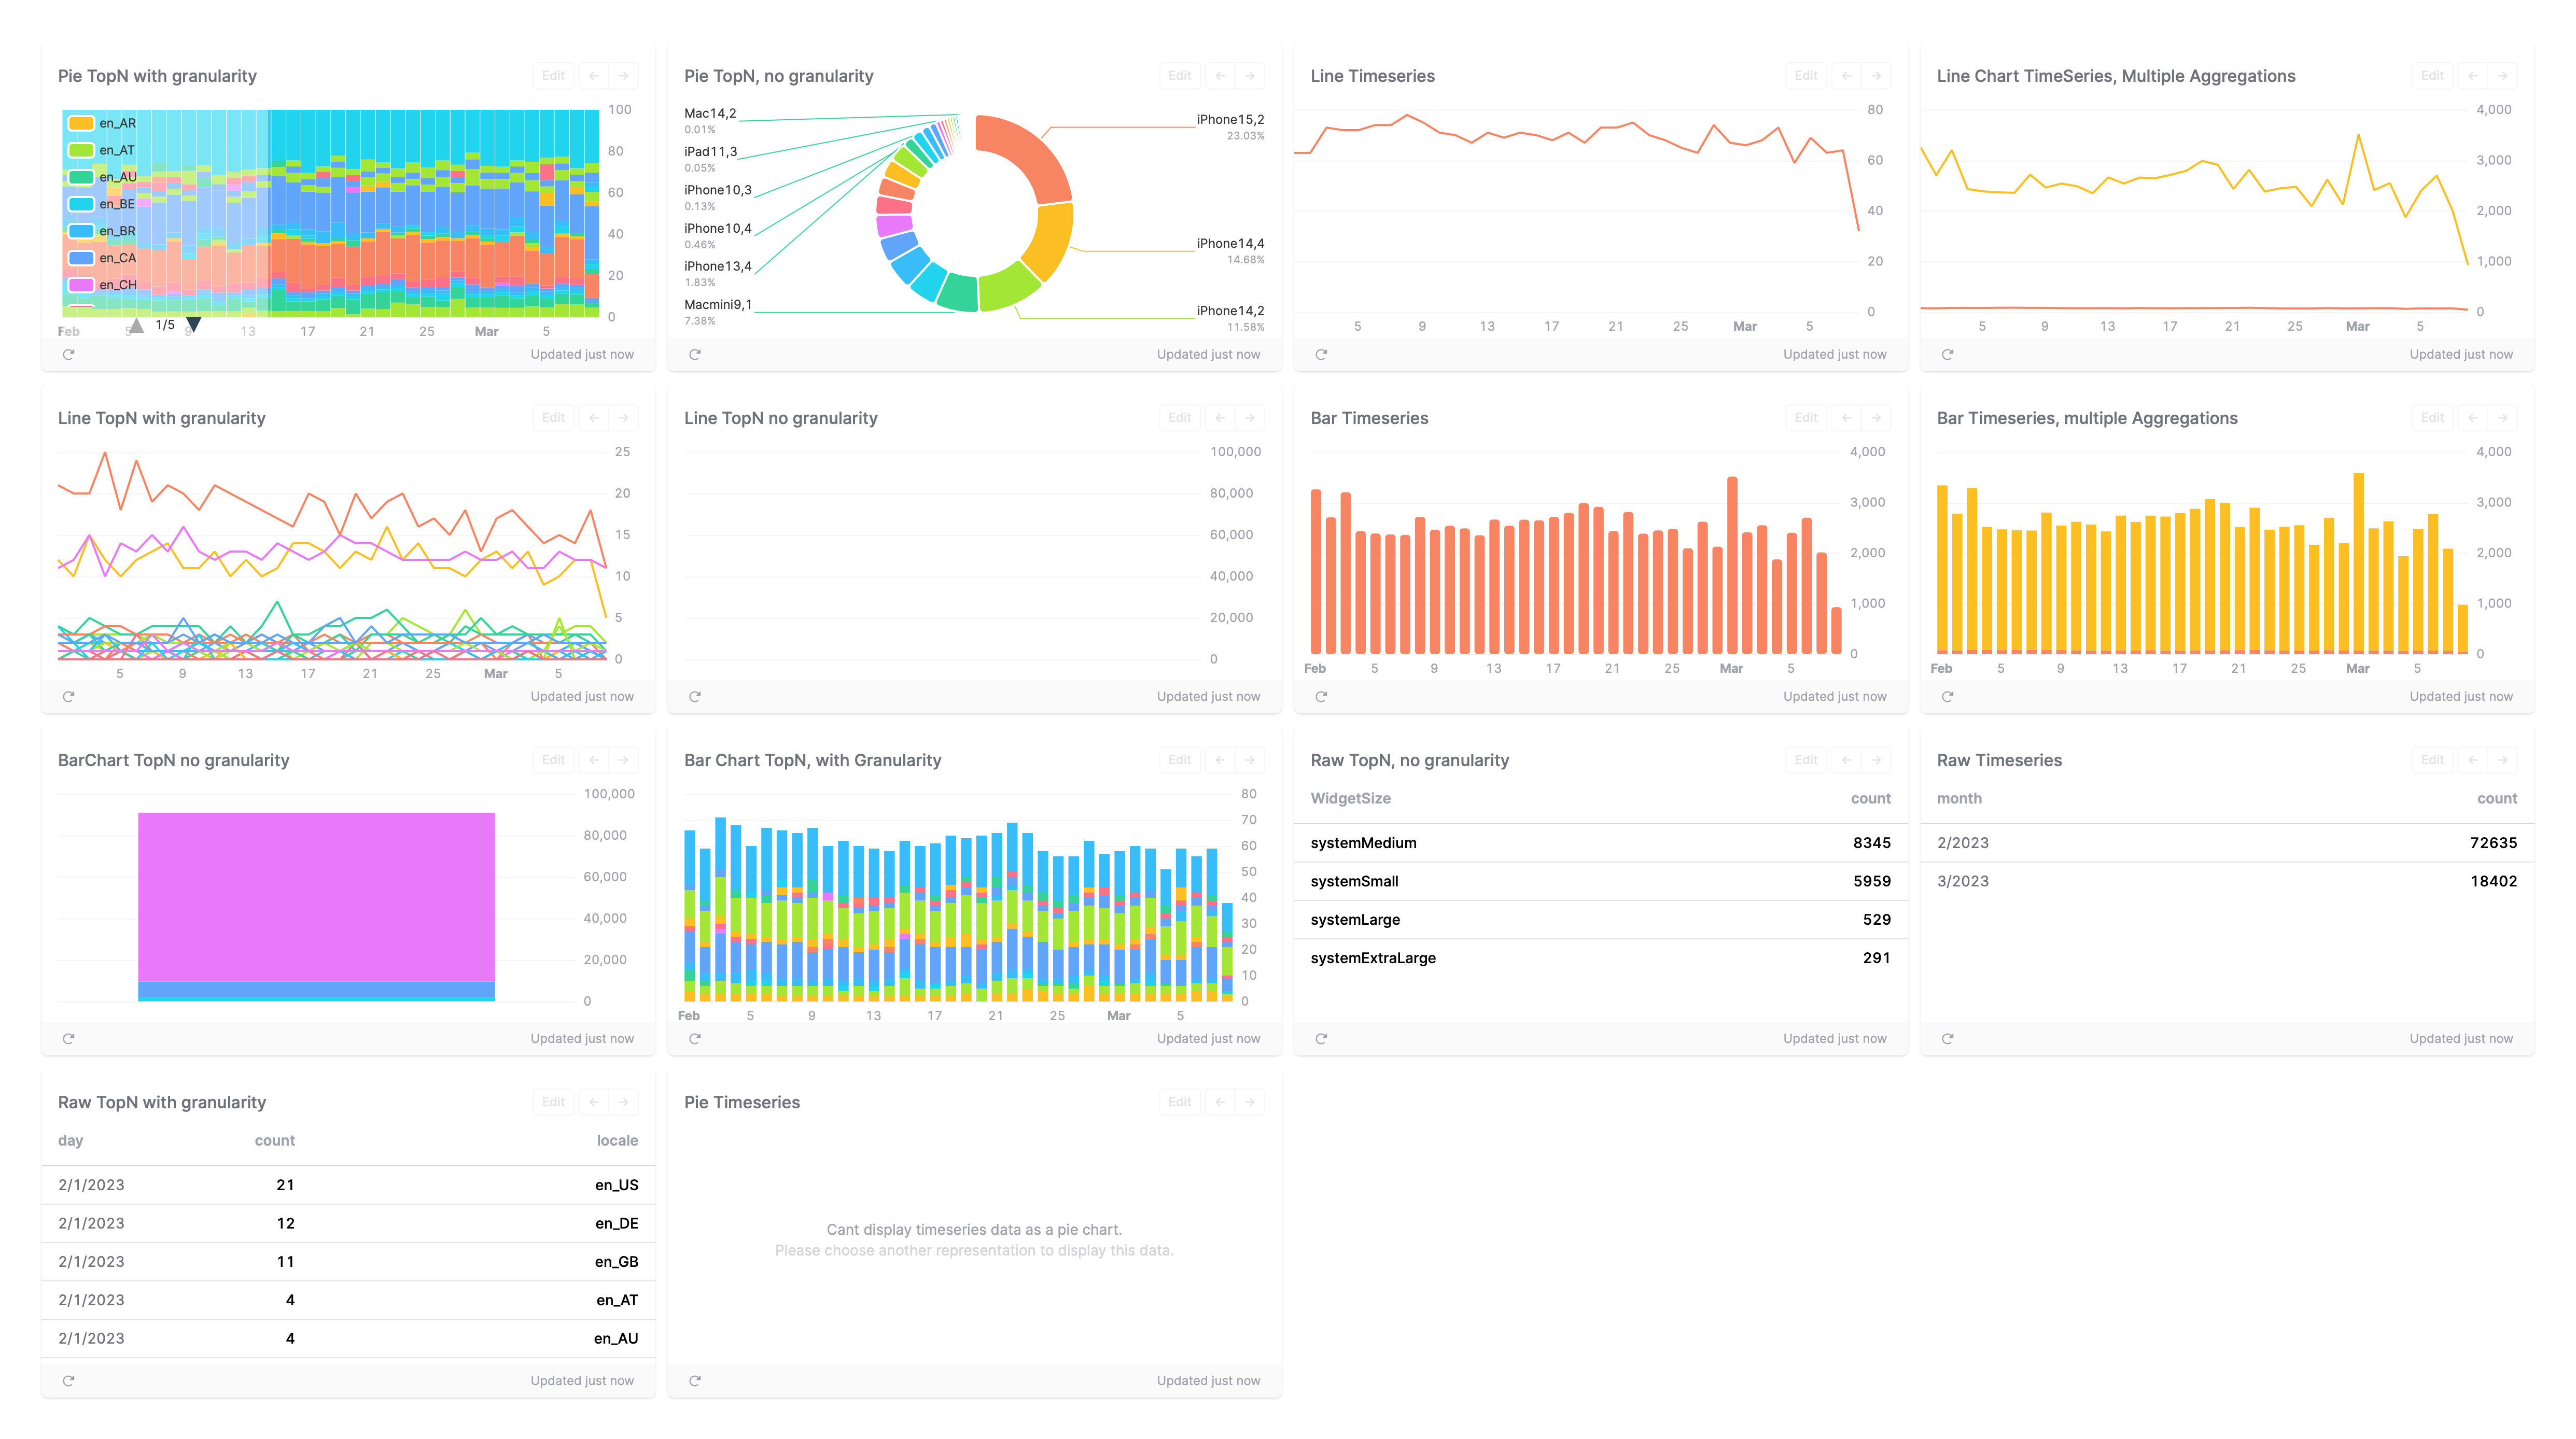
With the new update, we also completely revamped our chart system, making charts more performant, including better distinguishable colors, and allowing for new types of charts such as the new funnel charts.
The new charting system is also more flexible in accepting and displaying other types of data, especially in regards to the granularity of a query (which allows you to group data by day, week, month, year, or just to put all your data into one bucket): before, pie charts were unable to display granular data.
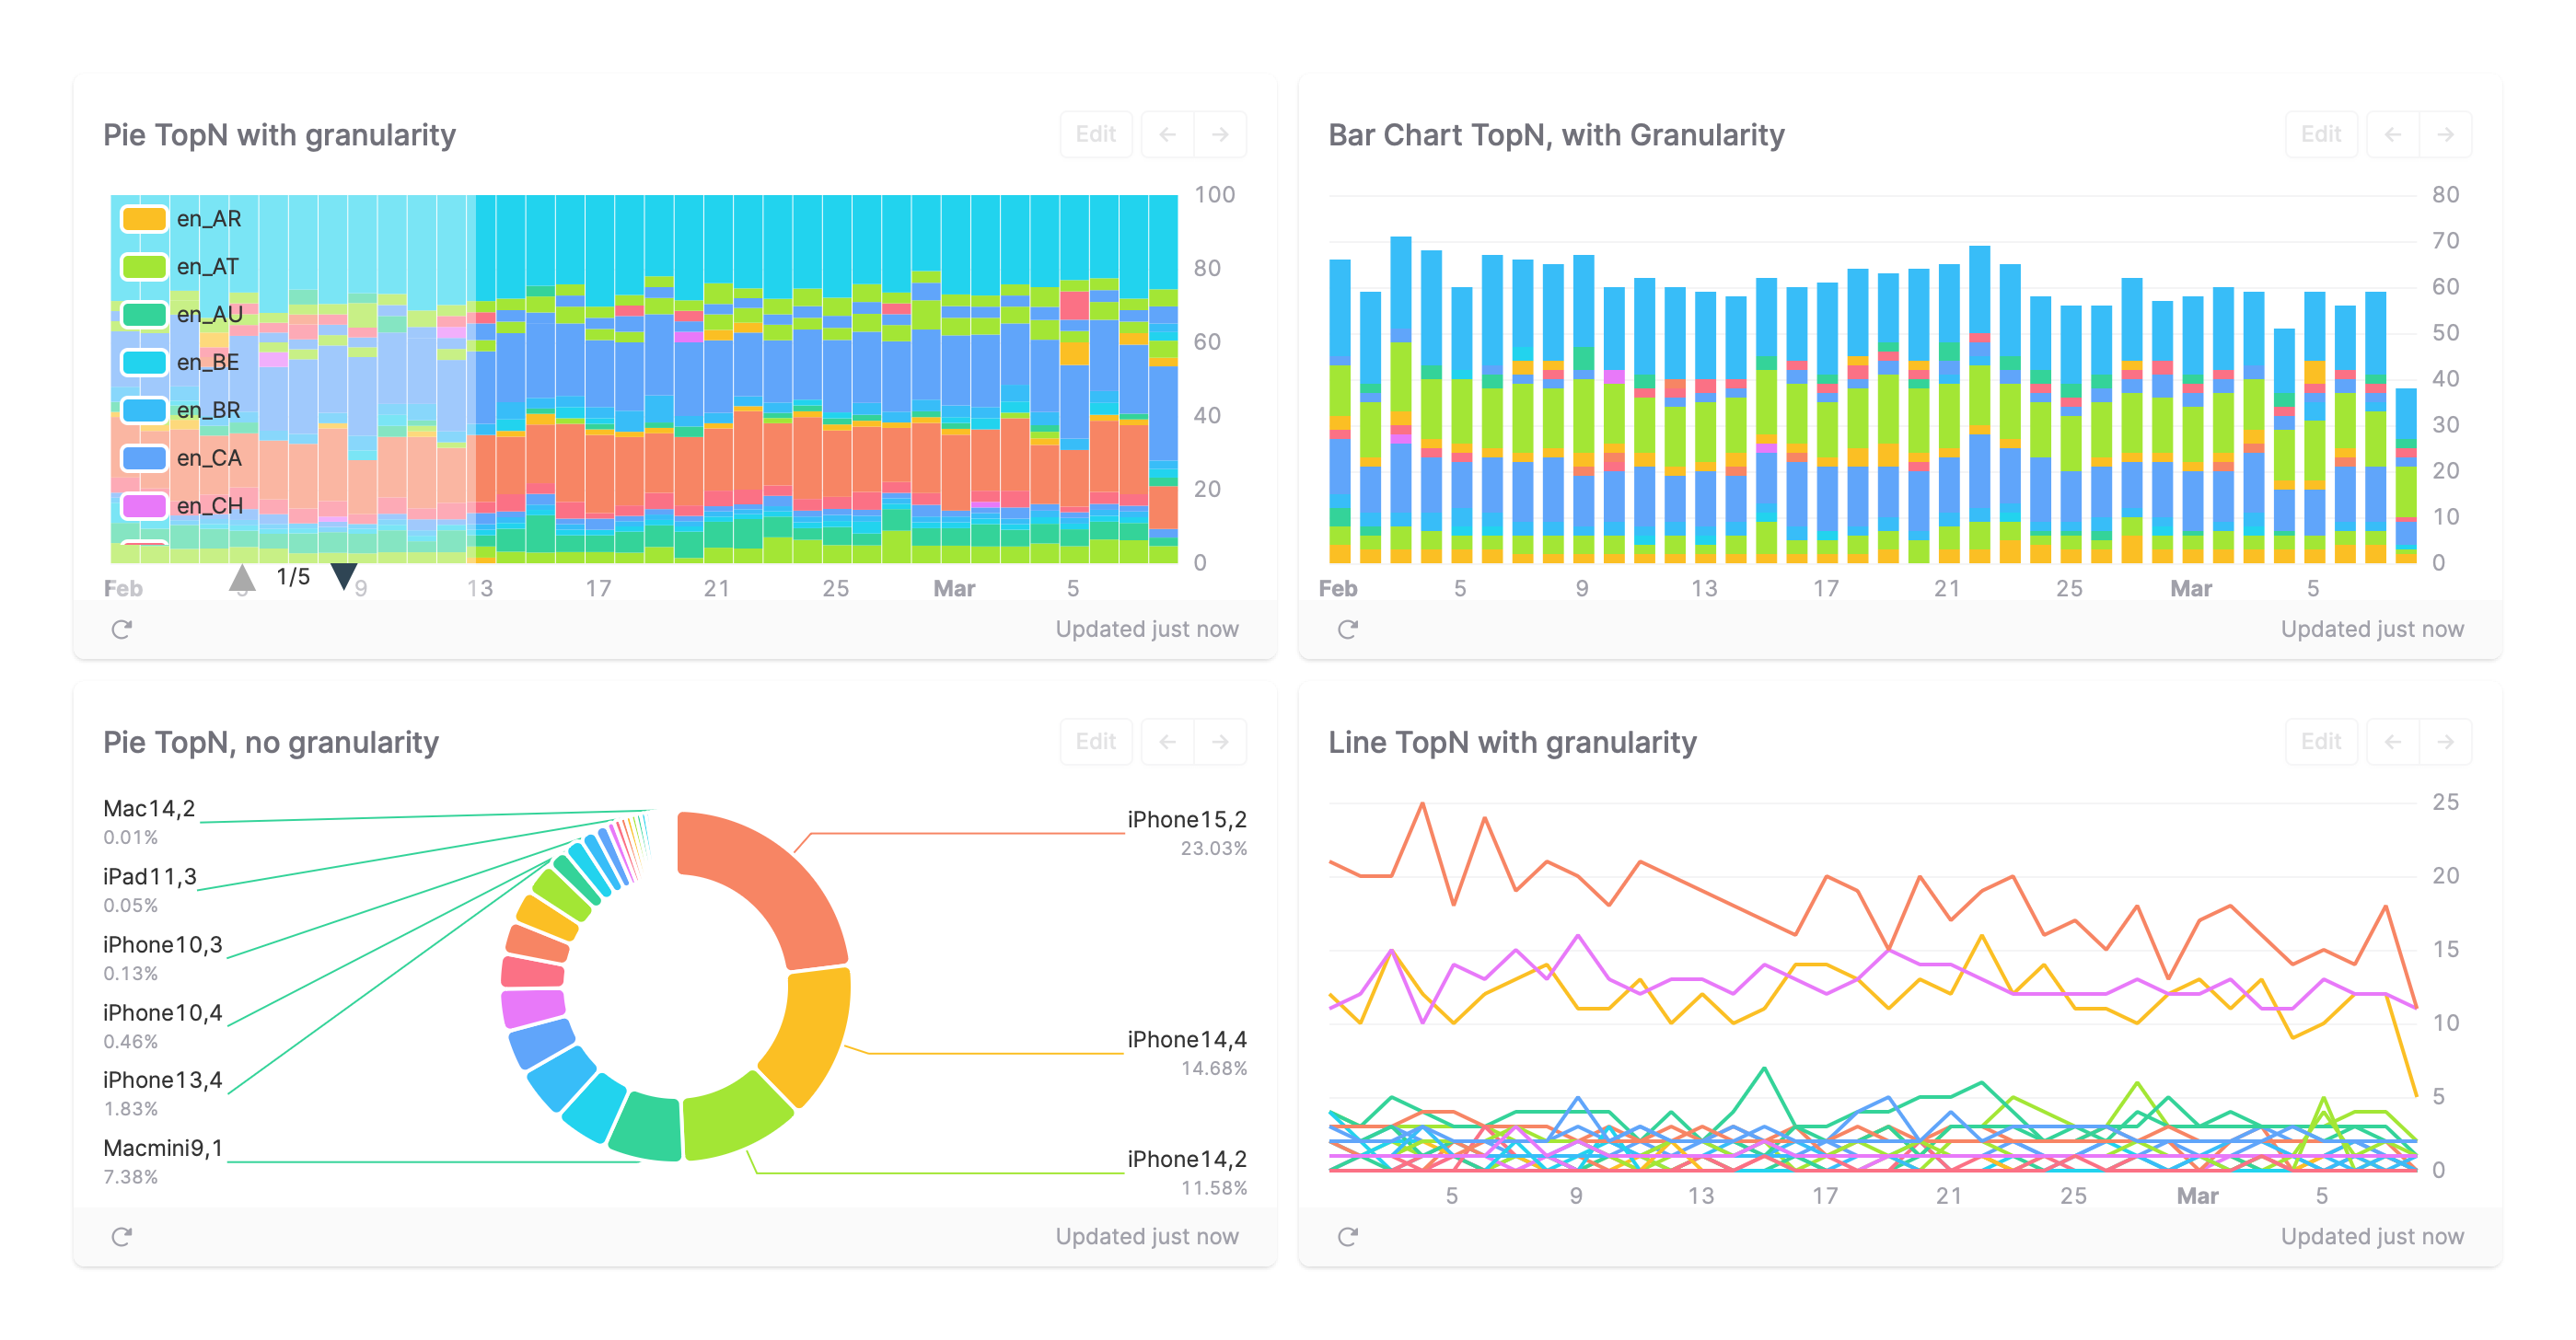
TopN queries with granularities can now be displayed as Bar Charts, Line Charts, and Pie Charts.
- In Bar Charts, we will stack the values so you can get an idea of the total
- in line charts we will graph the values next to each other so you can find out how they compare
- and in pie charts, we display the data proportionally, so for each day/week/month, you’ll see the percentage of values.
In TimeSeries queries, you can now display multiple aggregations at once in both line and bar charts, although you’ll have to write the query by hand for now.
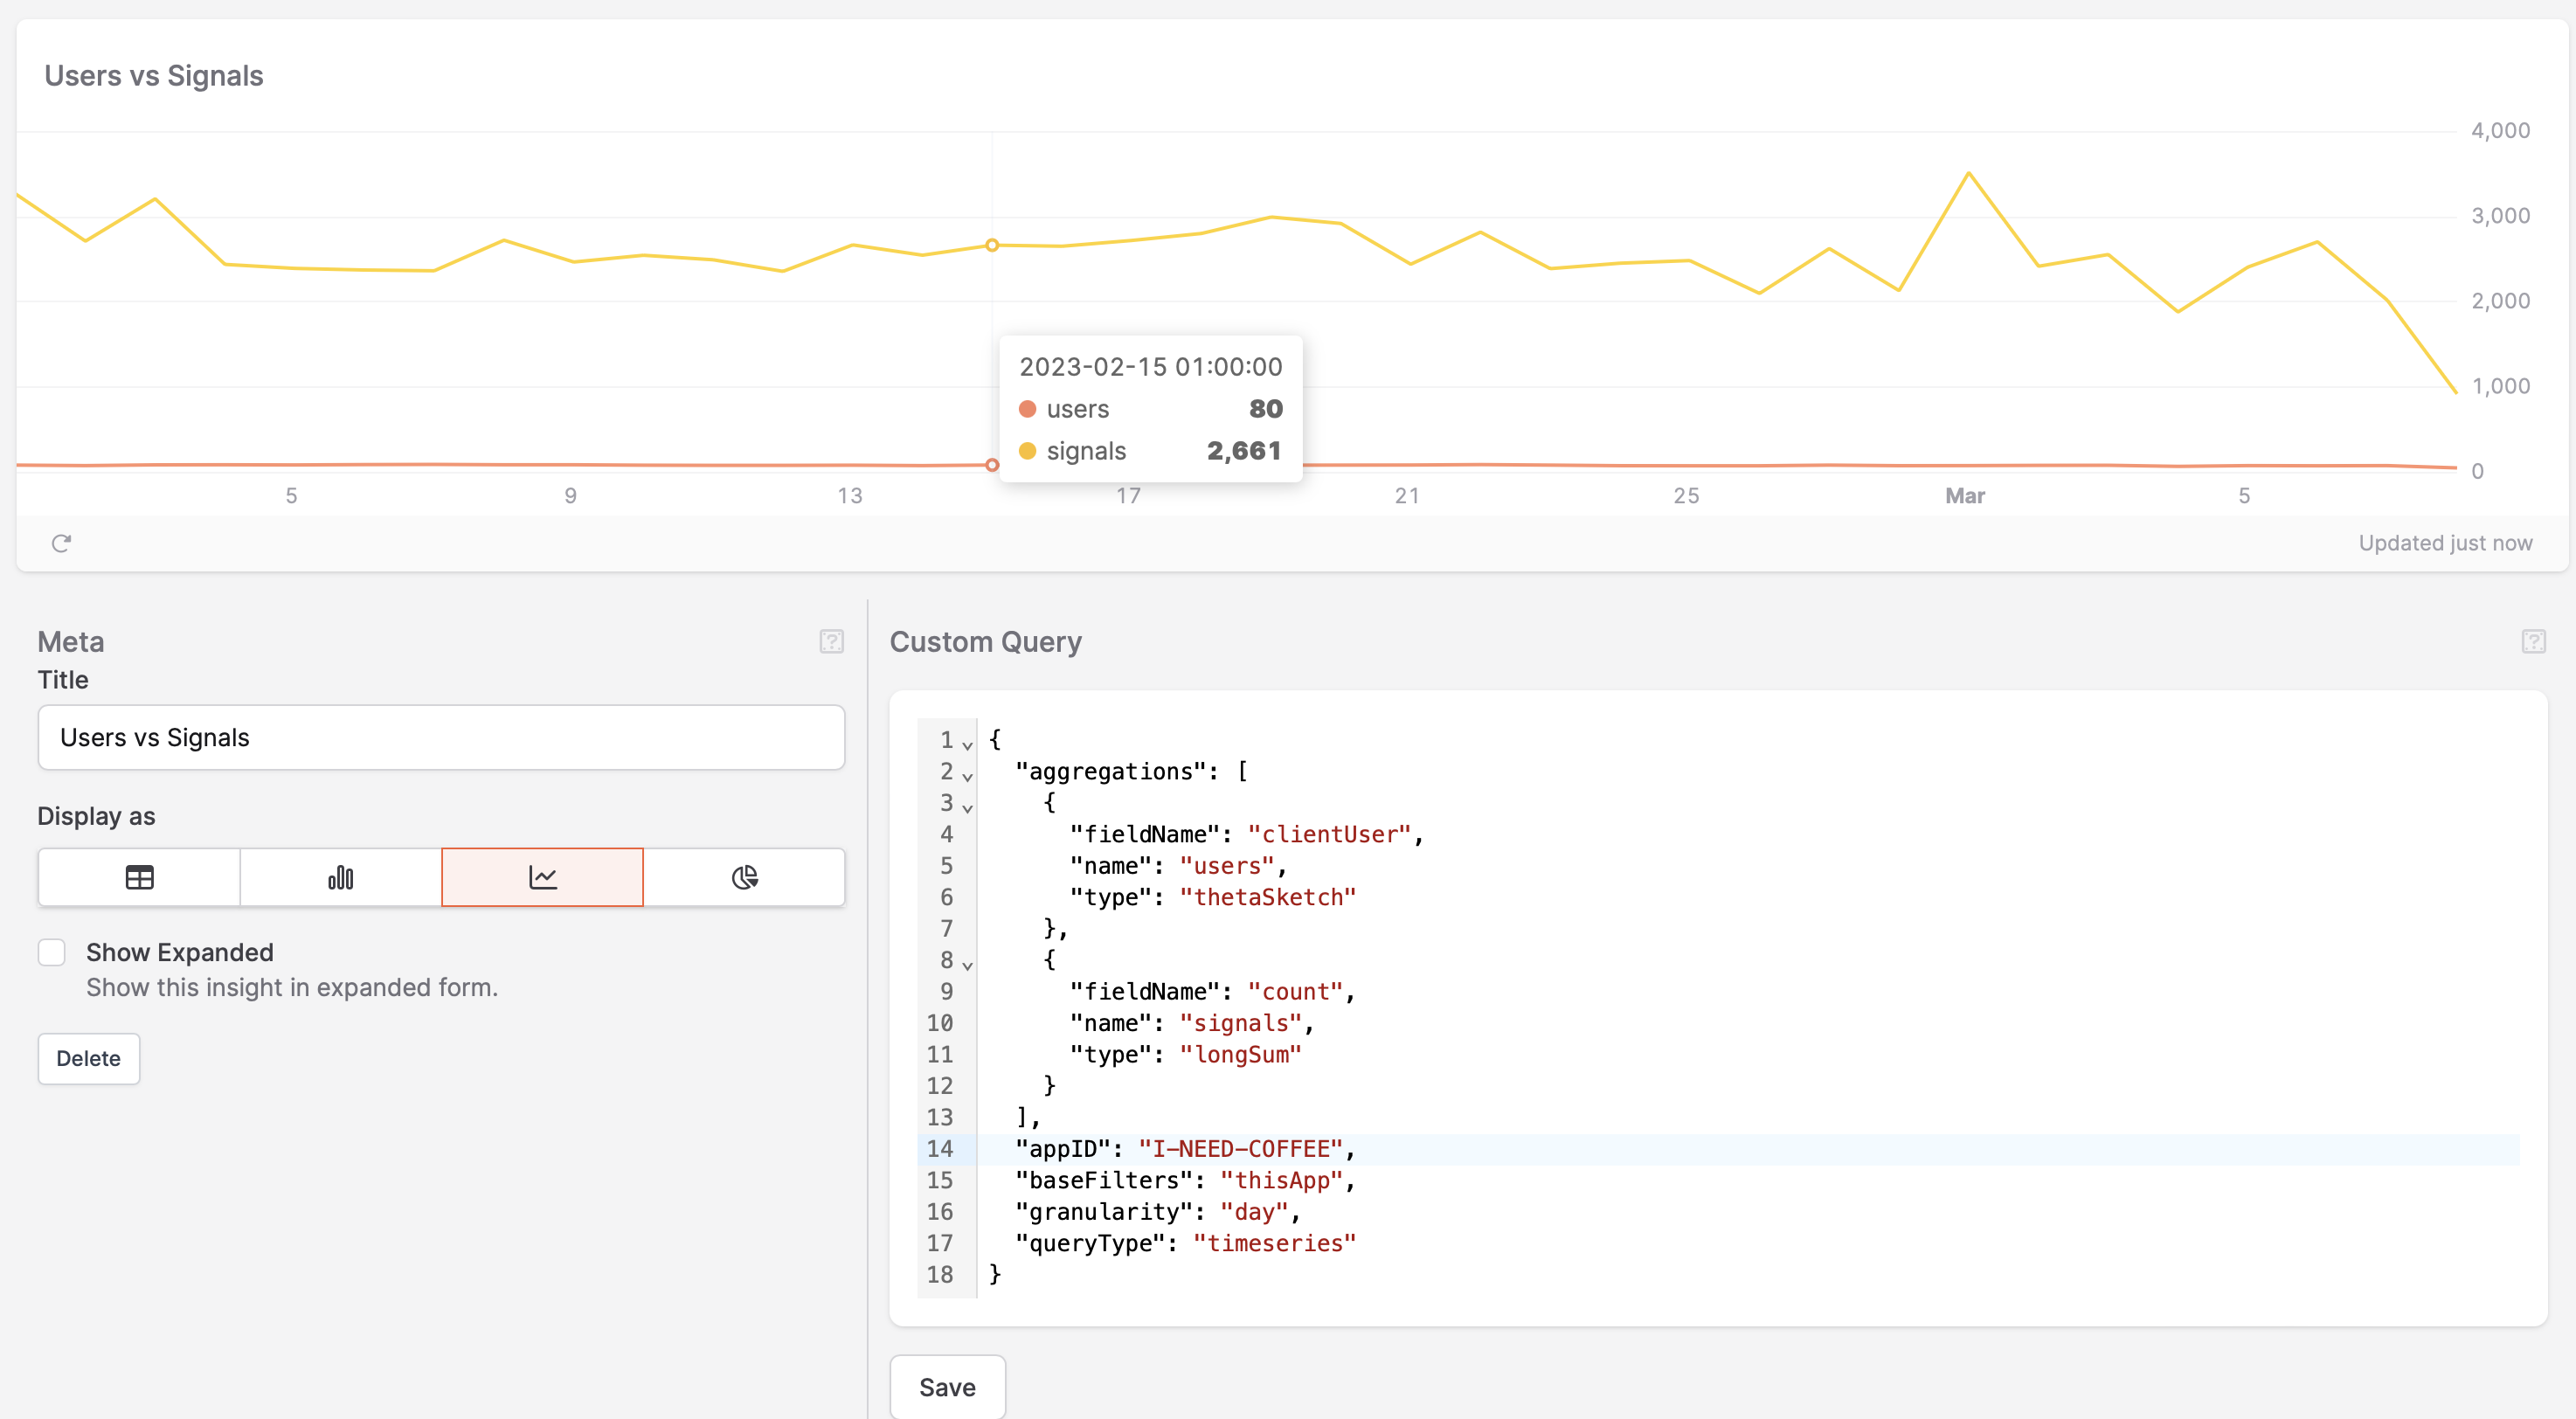
We’re super excited about the new charting system and are hoping to do more cool stuff with it in the future!
Updated layout for the Insight Editor
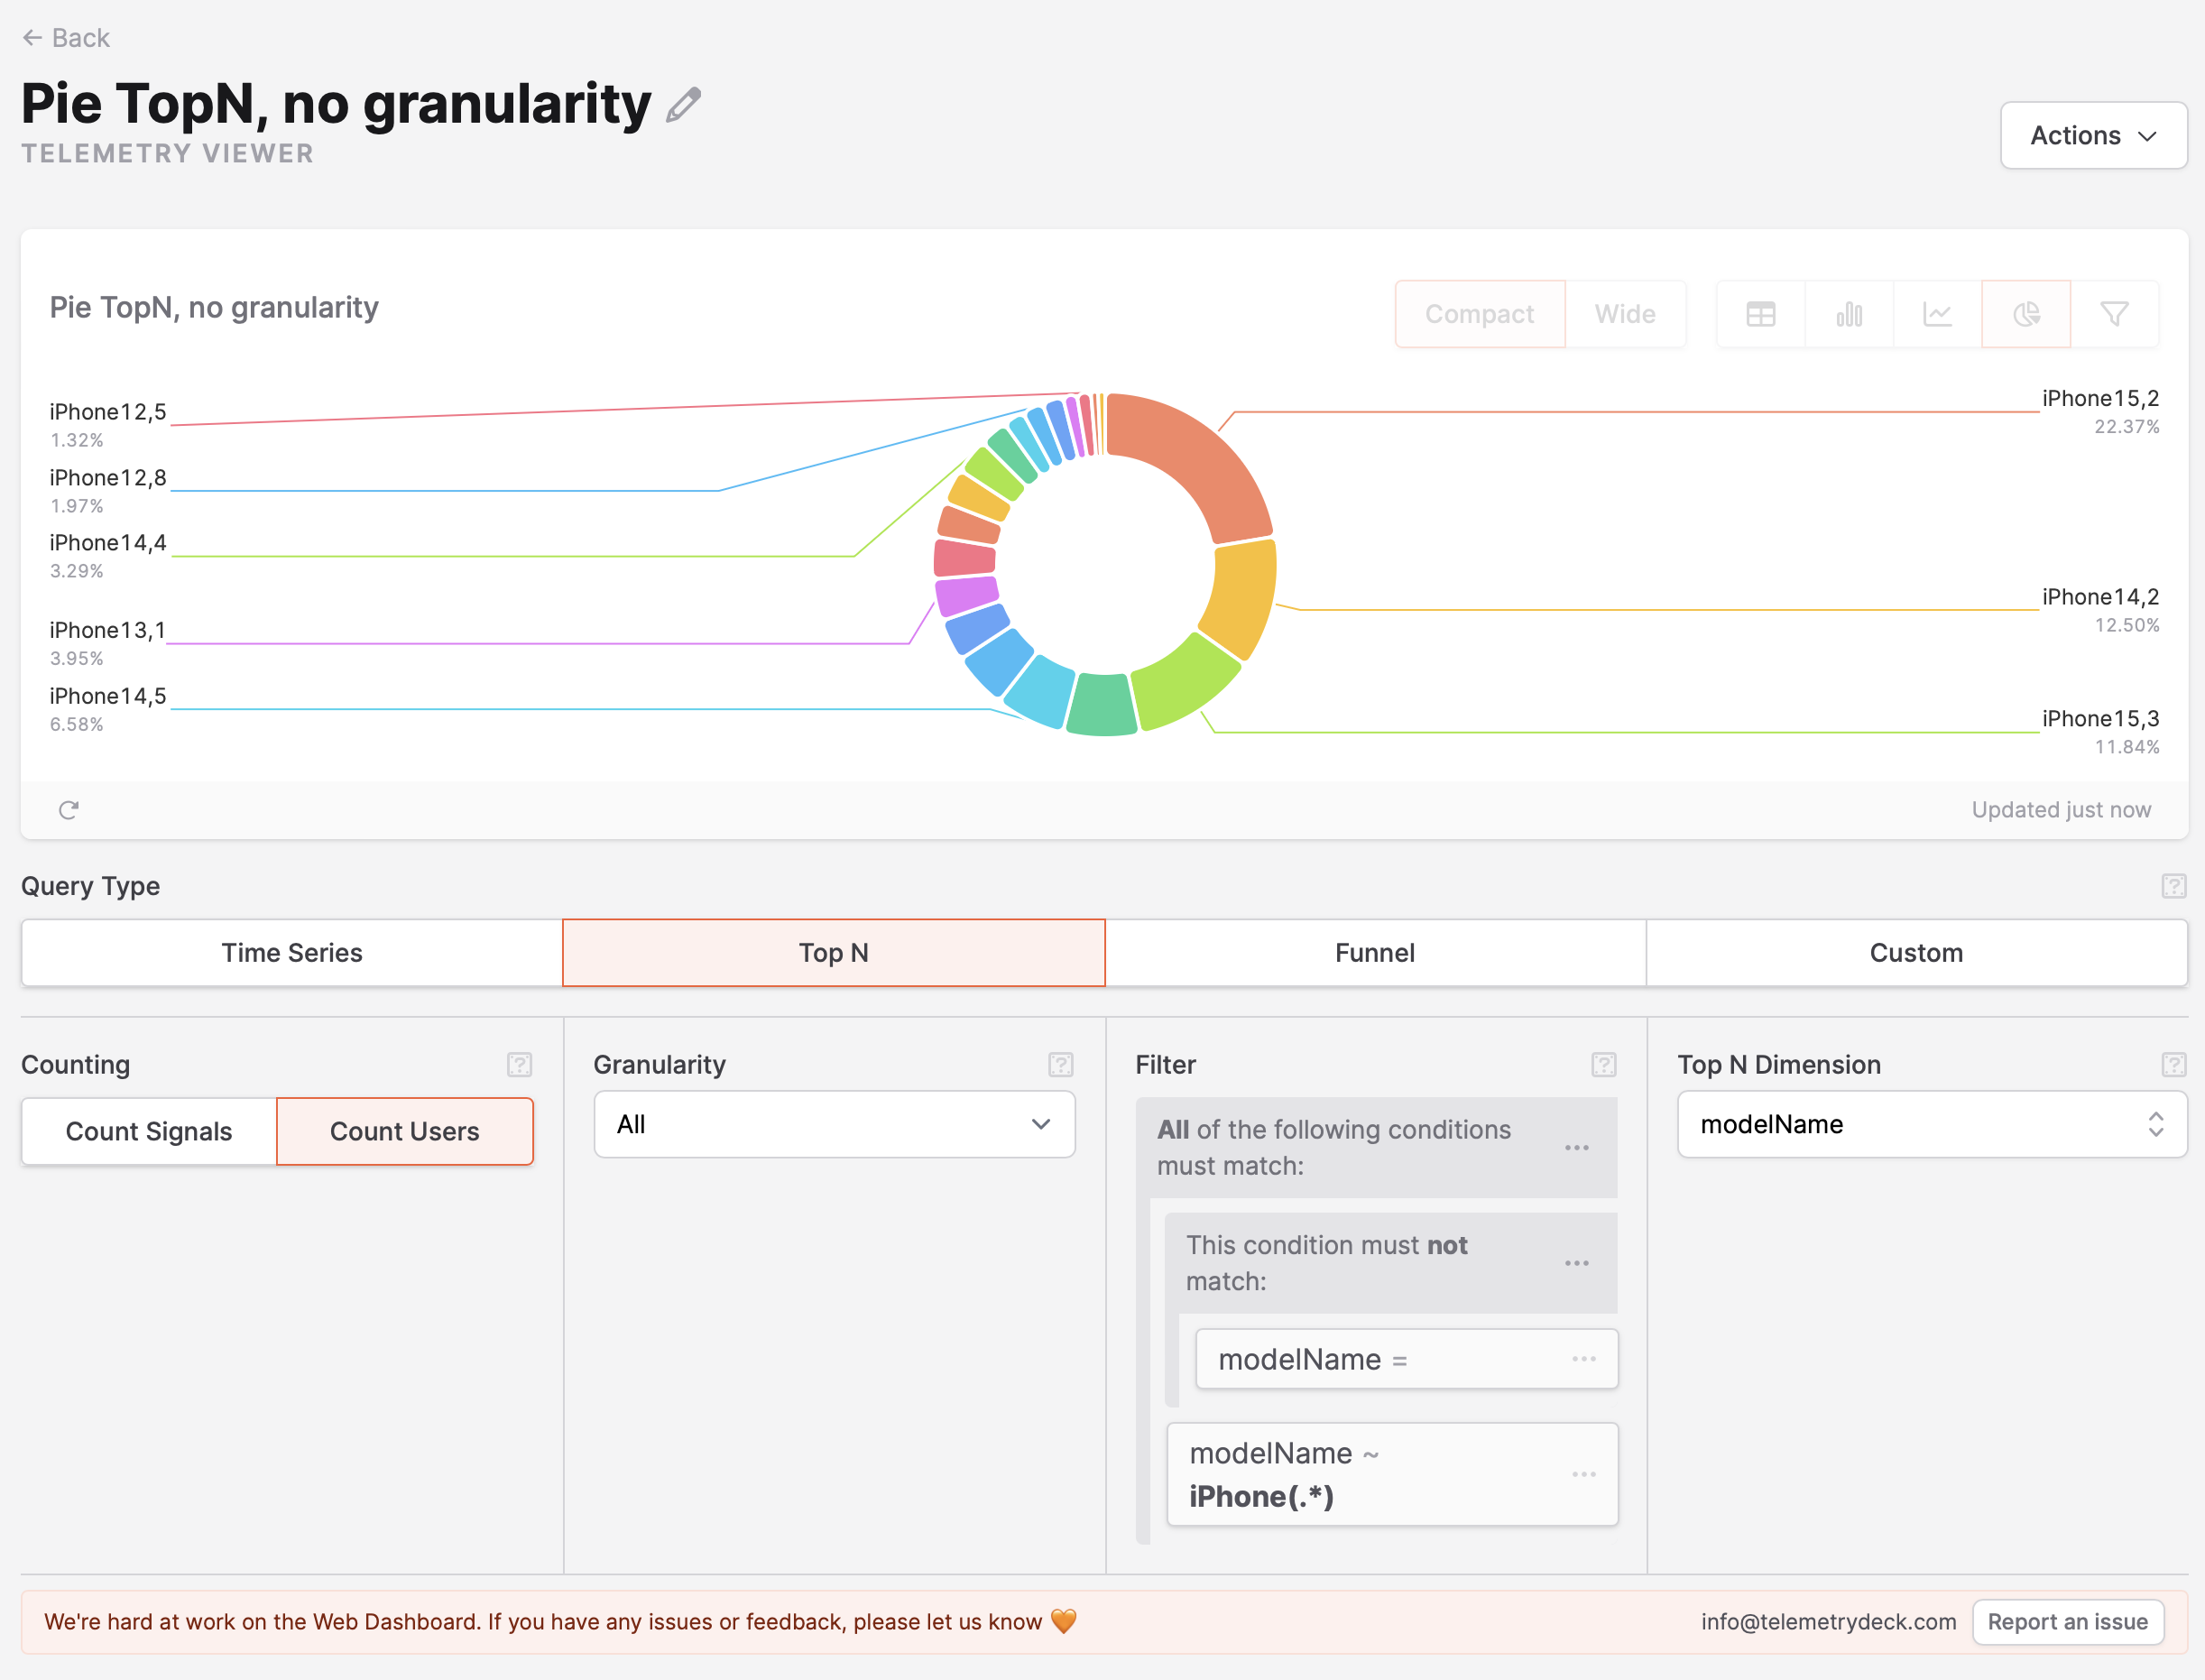
The insight editor has also received an update in this latest release. The new layout is more intuitive and makes it easier for users to create and edit insights. Also, it was kinda necessary to make space for the funnel editor!
- We changed the layout to be more hierarchical: select a query type (Time Series, Top N, Funnel, Custom) and you’ll get the controls that you need to set up exactly that query type.
- Controls that deal with the insight as such have moved into an Actions menu in the top left, which will grow in the future as we add more actions here.
- Controls that pertain to the visual presentation of the insight have moved into the insight card itself.
- The new insight editor also includes a “Report Issue” button that will directly open an issue in our GitHub. If you find anything at all that you’d like changed, please use this button a lot to request features or report bugs!
Let’s go!
For a lot of our awesome customers, funnels are an important feature that they were eagerly waiting for, and it feels amazing to be finally able to deliver them.
A lot of preparation work went into this feature: from, from the transformation to the TelemetryDeck Query Language, over our sneaky addition of the Intersection Post-Aggregator, to the Filter Editor and query pre-compilation feature that the funnel queries are built on. And all of these base layers give us even more opportunities to build on them!
We can’t wait to see what you’ll build with funnels! Please share your screenshots and stories, and let us know what you think.
Thanks for being awesome!
– Daniel

